
If you’re still ignoring the RSI (Relative Strength Index) when trading crypto, you might as well be lighting your Satoshis on fire. This indicator isn’t just a squiggly line—it’s a weapon. A tool used by elite traders to time entries, catch reversals, and squeeze every last drop of profit out of the market. And today? I’m handing you the keys.
Let me walk you through how to read RSI like a Wall Street savage and apply it like a crypto sniper. All killer. No filler.

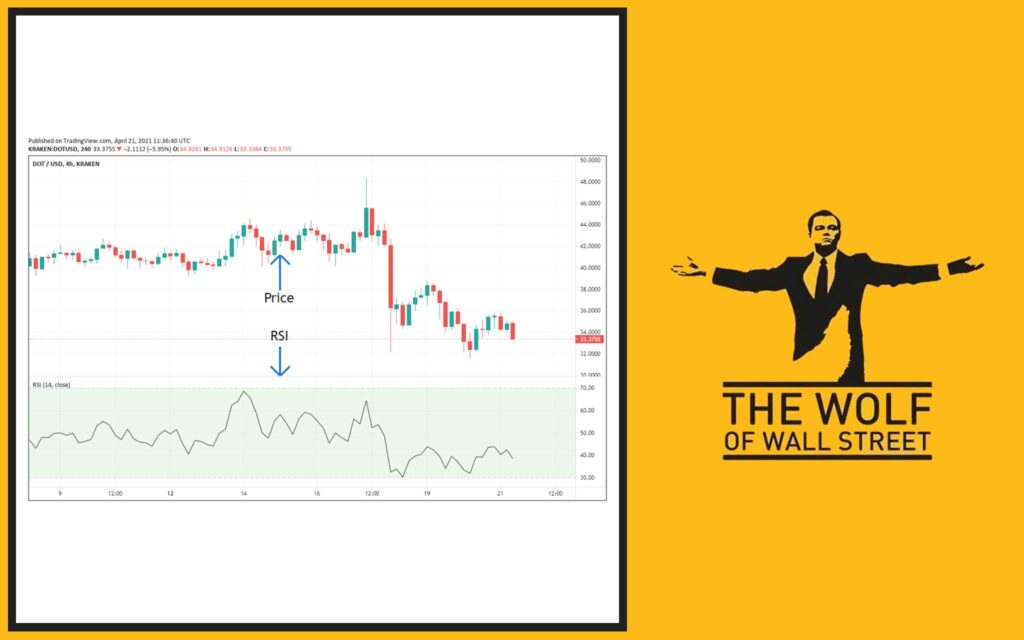
📊 What Is RSI, Really?
RSI stands for Relative Strength Index. Sounds fancy? Forget the name—this baby measures momentum. Developed by J. Welles Wilder, it bounces between 0 and 100 to show whether a market is overbought or oversold.
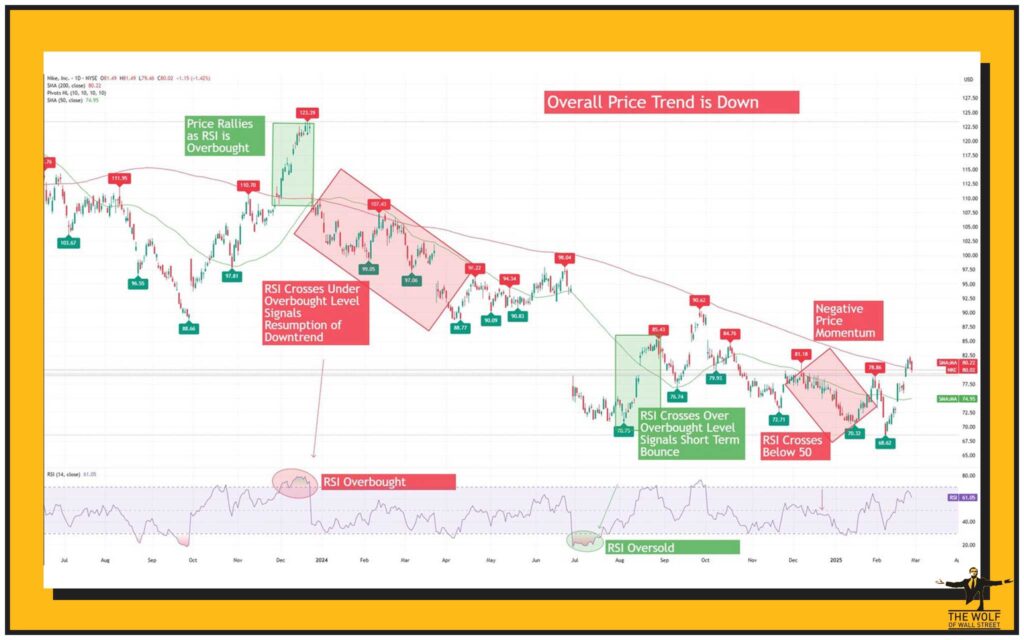
- RSI > 70: Market’s running hot. Could be topping out.
- RSI < 30: Market’s freezing. Could be bottoming.
- RSI = 50: Neutral. But here’s the kicker—smart traders use this like a trend filter.
Use RSI like a thermometer. You wouldn’t walk outside in a blizzard in swim shorts, right? Same logic in the markets.
🎯 Overbought? Oversold? That’s Where Money Gets Made
The 70/30 levels? That’s your sweet spot. When RSI crosses above 70, it doesn’t mean “sell now” – it means prepare. When it drops below 30, it means load your gun.
Here’s how the pros play it:
- Above 70: Look for weakening momentum. Combine with candle patterns like bearish engulfing.
- Below 30: Watch for price bottoming signals. Bullish divergence is your golden goose.
It’s all about confluence – stack signals, and your odds skyrocket.
Want more on timing trend shifts? Check out our section on for advanced setups.
🧭 RSI at 50: The Line Between Trend and Trash
Nobody talks about RSI 50. But it’s vital. It acts as a momentum midpoint.
- Above 50 = bullish territory
- Below 50 = bearish territory
If RSI flips from below to above 50 with price breaking a resistance? That’s your breakout setup, baby.
🔍 Divergences: The Smart Money’s Secret Weapon
Divergence is when RSI and price stop dancing together. That disconnect? It’s a hint the trend is about to snap.
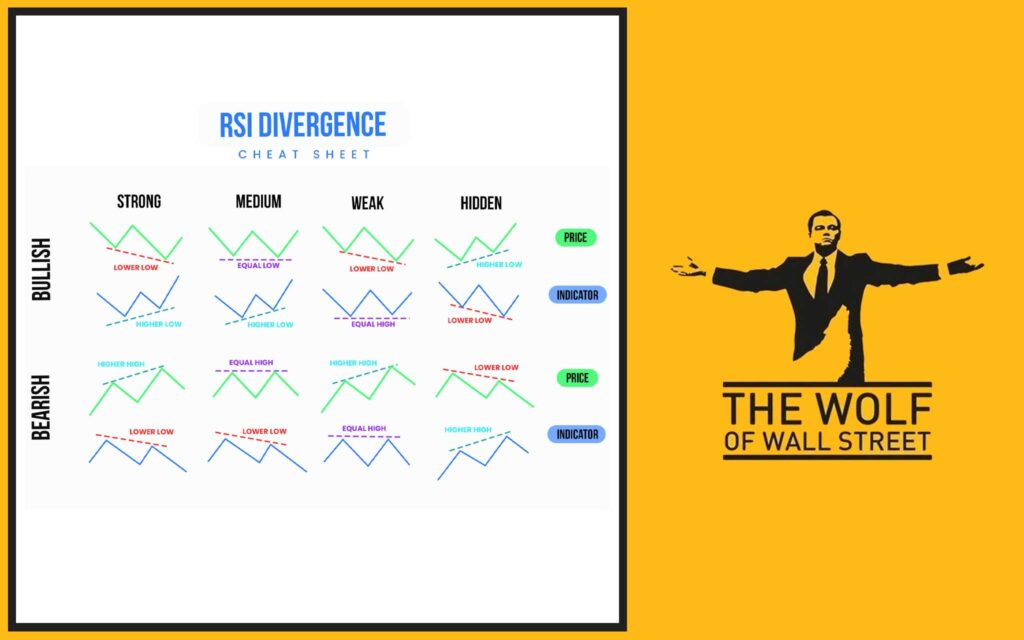
⚡ Bullish Divergence
- Price makes lower lows
- RSI makes higher lows
- Translation? Bears are running out of steam. Time to strike.
🔥 Bearish Divergence
- Price makes higher highs
- RSI makes lower highs
- Bulls losing momentum. Exit before the dump.
📝 Hidden Divergence: Trend Trader’s Ace Card
- Occurs with the trend
- Suggests continuation
- Perfect for those riding trends, not just reversals
Explore more examples of this in our guide for pattern recognition.
🛠️ RSI on TradingView: Set It Up Like a Pro
- Open any chart on TradingView.
- Click “Indicators.”
- Search for “RSI.”
- Boom—you’re live.
Pro Settings:
- Period: 14 (default)
- Overbought: 70
- Oversold: 30
- Add a middle line at 50 manually
Overlay RSI below your price chart for clarity. Add trendlines on RSI itself – that’s where the edge comes alive.

🧬 RSI Settings That Actually Work
There’s no holy grail, but tweak depending on your style:
- Scalpers: RSI period = 7 to 9
- Swing traders: Stick with 14
- Position traders: Try 21+ for smooth trends
Backtest. Always.
📌 Example Setups That Print Money
- RSI < 30 + Hammer Candle + Support Zone = BUY
- RSI > 70 + Doji + Trendline Break = SELL
- RSI Divergence + Volume Spike = High-Conviction Entry
Deep dive on price confluence in our ecosystem breakdowns.
❌ RSI Mistakes That Blow Up Portfolios
- Buying just because RSI < 30 (wait for confirmation)
- Ignoring higher timeframe RSI trends
- Using RSI alone (don’t be lazy)
- Over-trading divergence (pick high-probability zones only)
Smart money plays defense too. Never forget that.
⚔️ RSI + MACD + Volume: The Holy Trinity
When RSI shows divergence, MACD shows crossover, and volume spikes? That’s the trader’s jackpot.
- RSI = timing
- MACD = trend direction
- Volume = conviction
Stack these, and your entries become weapons-grade.
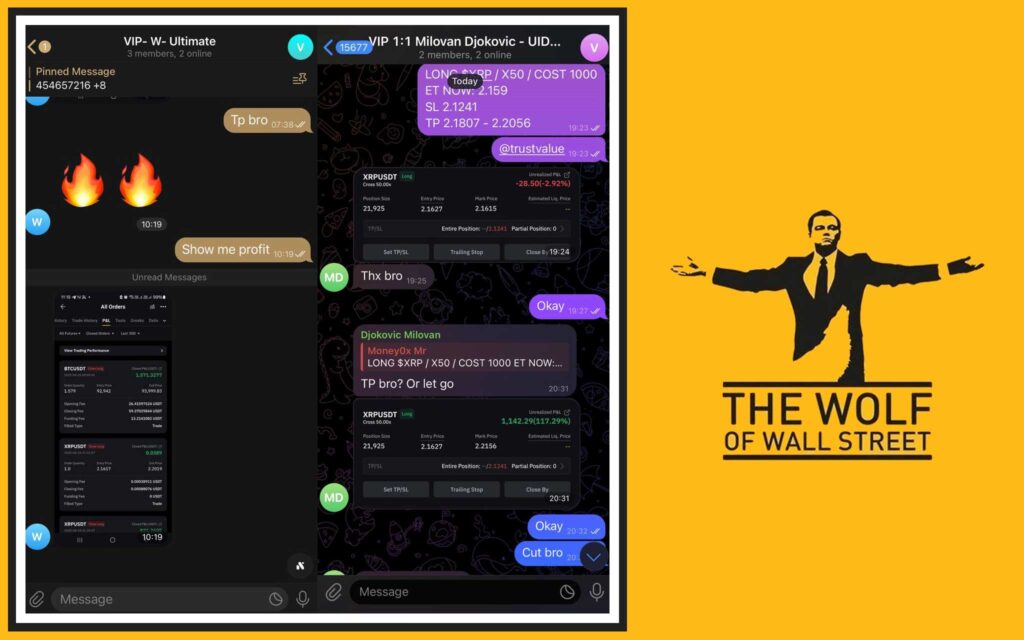
🌟 The Wolf Of Wall Street Traders Use RSI Like a Laser
Inside the The Wolf Of Wall Street crypto trading community, RSI isn’t just a tool—it’s part of the system. Our VIP Signals combine RSI divergences with volume and structure to deliver precision entries.
What do you get?
- Real-time alerts when RSI setups align
- Expert analysis explaining the WHY
- Private chat with 100,000+ focused traders
Join the winning side. No fluff. Just signals and skill.
Our memecoin RSI alerts have been featured in the section with top callouts.
💼 Why You Need The Wolf Of Wall Street in Your Trading Arsenal
Let’s be real. RSI is powerful—but on its own, it’s a knife in a gunfight. You need the full toolkit:
- Exclusive VIP Signals – built around real RSI-based strategies
- Live market analysis 24/7
- Tools like volume calculators
- Support whenever you need it
Ready to make your RSI trades bulletproof? Get inside:
- Website: https://tthewolfofwallstreet.com/
- Telegram: https://t.me/tthewolfofwallstreet
Or explore trading signals and indicators in our trending picks.
📚 RSI Glossary
- Overbought: RSI > 70, asset may be peaking
- Oversold: RSI < 30, asset may be bottoming
- Divergence: RSI moves opposite of price
- Hidden Divergence: RSI moves with trend, signals continuation
- Momentum: Speed and strength of price movement
🔁 Key Takeaways
- RSI helps spot trend strength and reversal signals
- Watch the 30/70 zones and the critical 50 midpoint
- Use RSI divergence as a lead indicator
- Don’t use RSI alone—combine with volume and structure
- The Wolf Of Wall Street integrates RSI into a complete trading system
❓ FAQs
1. What timeframe is best for RSI?
RSI works on all timeframes. Use 1h+ for clean signals.
2. Is RSI better than MACD?
Different tools. Combine both for best results.
3. Can I use RSI on altcoins or memecoins?
Yes—especially effective in volatile markets.
4. Should I only trade when RSI hits 30 or 70?
No. Wait for confirmation from structure or candles.
5. What’s the RSI win rate?
Depends on setup. Divergence plus structure often exceeds 60%.
The Wolf Of Wall Street crypto trading community offers a comprehensive platform for navigating the volatile cryptocurrency market. Here’s what you gain:
- Exclusive VIP Signals: Access proprietary signals designed to maximize trading profits.
- Expert Market Analysis: Benefit from in-depth analysis from seasoned crypto traders.
- Private Community: Join a network of over 100,000 like-minded individuals for shared insights and support.
- Essential Trading Tools: Utilize volume calculators and other resources to make informed decisions.
- 24/7 Support: Receive continuous assistance from our dedicated support team.
Empower your crypto trading journey:
- Visit our website: https://tthewolfofwallstreet.com/ for detailed information.
- Join our active Telegram community: https://t.me/tthewolfofwallstreet for real-time updates and discussions.
- Unlock your potential to profit in the crypto market with The Wolf Of Wall Street