
Forget about chasing every rumour. The real money is made by understanding the big picture, the major trends that drive markets over time. Dow Theory is the bedrock of seeing those trends. Developed over a century ago, its principles still hold serious weight. This isn’t just history; it’s the foundation of smart trading. Get this right, and you see the market with new eyes.

📜 The Origins: Charles H. Dow and His Vision
So, who are we talking about here? Charles H. Dow. This guy wasn’t just running around yelling about stocks. He was a serious thinker, a co-founder of Dow Jones & Company and the first editor of The Wall Street Journal. Back in the late 19th and early 20th centuries, he started writing editorials where he shared his observations about market movements. He believed that markets weren’t just random casinos; they reflected the overall state of business and investor psychology.
Dow observed that prices moved in discernible patterns and that these patterns could give clues about the future direction of the market. His work, later compiled and expanded upon by others like S.A. Nelson and William Peter Hamilton, became known as Dow Theory. It’s important because it was one of the first structured approaches to analysing market data to forecast trends, laying the groundwork for much of modern technical analysis.
💎 The Six Tenets: Core Principles That Still Hold
Dow Theory is built on six fundamental tenets. These principles, though old, provide a solid framework for looking at market behaviour.
The Market Discounts Everything
This is a core belief not just in Dow Theory but in much of technical analysis. It states that stock market prices reflect all available information. Everything that is known or can be known about a company, an industry, or the economy is already factored into the price of its stock or index. News, earnings reports, interest rate changes, political events – it’s all baked into the price. This means studying price action alone can give you a comprehensive view of market sentiment and expectations.
Market Trends Have Three Types
Dow observed that markets move in waves, and these waves fit into a hierarchy of three distinct trend types:
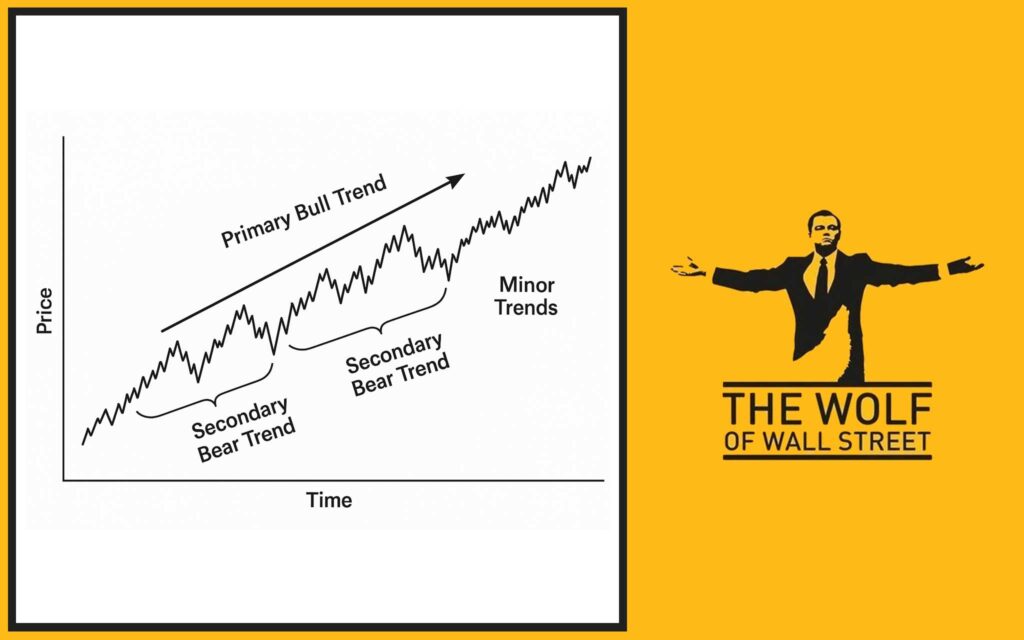
- Primary Trends: These are the major, long-term movements of the market. They can last from less than a year to several years. These are the “bull” markets (upward) and “bear” markets (downward) that define the big picture direction. Identifying the primary trend is the most crucial aspect of Dow Theory.
- Secondary Trends: These are intermediate-term moves that go against the primary trend. In a bull market, a secondary trend is a significant pullback or correction. In a bear market, it’s a substantial rally. Secondary trends typically last from three weeks to several months and retrace between one-third and two-thirds of the previous primary price move.
- Minor Trends: These are short-term fluctuations, noise in the market that lasts less than three weeks. They are considered unimportant in the context of identifying the major trend according to Dow Theory.
Primary Trends Have Three Phases
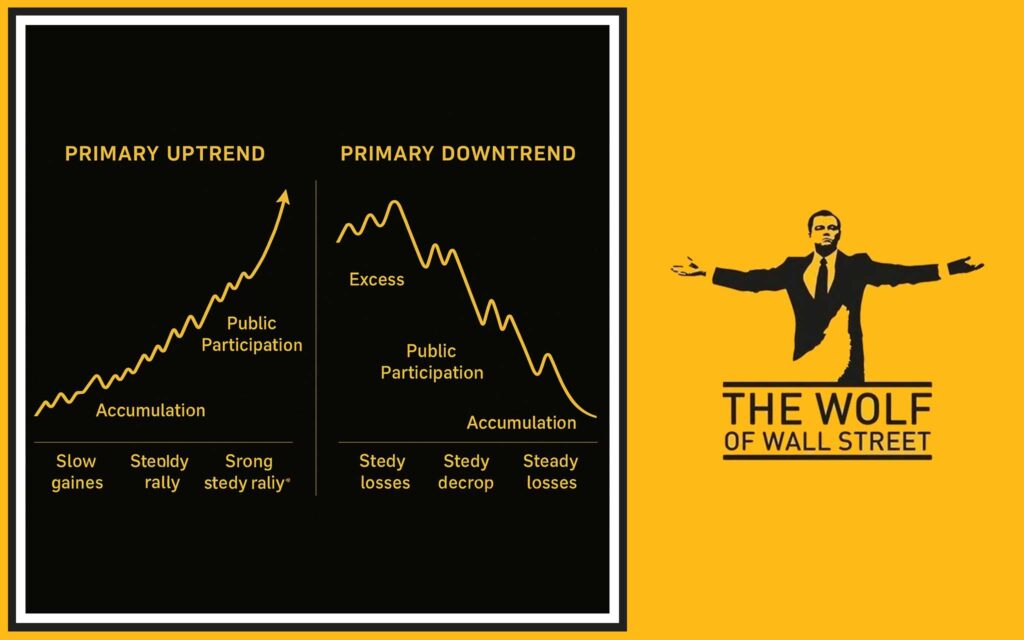
According to Dow Theory, a primary trend (both bull and bear markets) unfolds in three distinct psychological phases:
- Phase 1: Accumulation (Bull) / Distribution (Bear): In a bull market (Accumulation), informed investors and “smart money” begin buying an asset, seeing its value when the public is still pessimistic or unaware. Prices start to edge up quietly. In a bear market (Distribution), informed investors start selling, seeing prices as overvalued, while the public is still optimistic. Prices start to decline quietly. This phase is characterised by price consolidating in a range with relatively low public interest.
- Phase 2: Public Participation: This is where the majority of trend-following traders and the wider public catch onto the trend. News becomes increasingly positive in a bull market or negative in a bear market. Prices move strongly and quickly as participation widens. This is often the longest and most straightforward phase for profiting from the trend.
- Phase 3: Excess (Bull) / Panic (Bear): In a bull market (Excess), speculation runs rampant. Prices accelerate upwards based on hype and irrational exuberance, often reaching unsustainable levels. The public is fully invested, driven by greed. Informed investors may start to exit quietly. In a bear market (Panic), selling becomes disorderly and emotional. Prices collapse rapidly as fear grips the market, often overshooting to the downside. The public panics and sells near the lows. Informed investors may start to accumulate quietly. This phase is marked by extreme volatility.
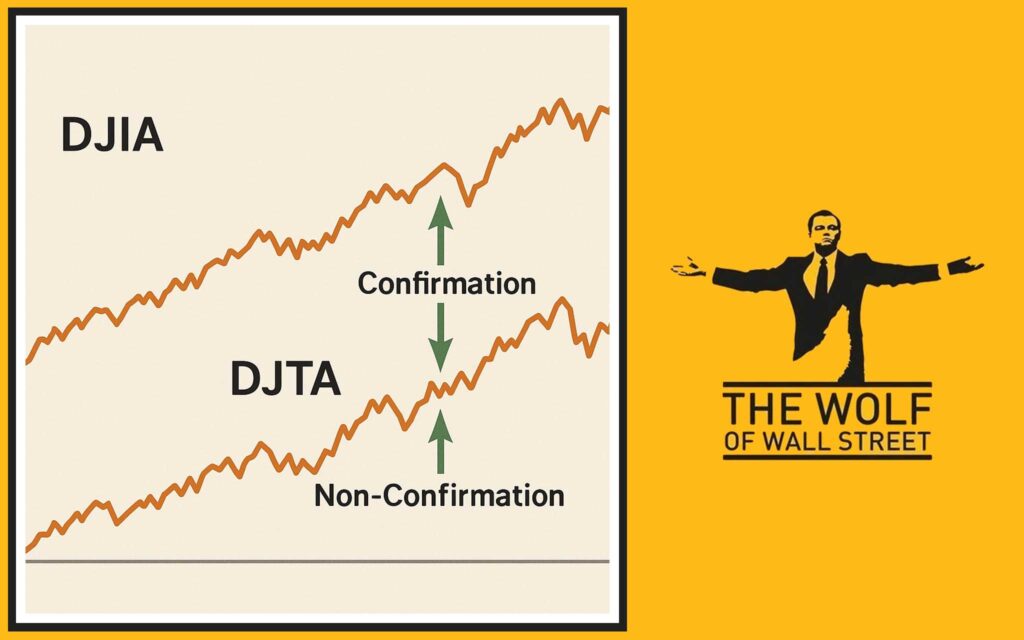
Market Averages Must Confirm Each Other
This is a cornerstone principle for validating signals. Originally, Dow used the Dow Jones Industrial Average (DJIA) and the Dow Jones Transportation Average (DJTA). The tenet states that a signal for a new primary trend or the continuation of an existing one in one average is not considered valid unless it is confirmed by a similar signal in the other average. For example, if the DJIA makes a new higher high, the DJTA must also make a new higher high to confirm the bullish trend. If the DJTA fails to do so, it’s a warning sign that the trend’s strength might be questionable. This reflects Dow’s view that industrial activity and the transportation needed to move goods should ideally move together to indicate true economic health and market direction.
Volume Must Confirm the Trend
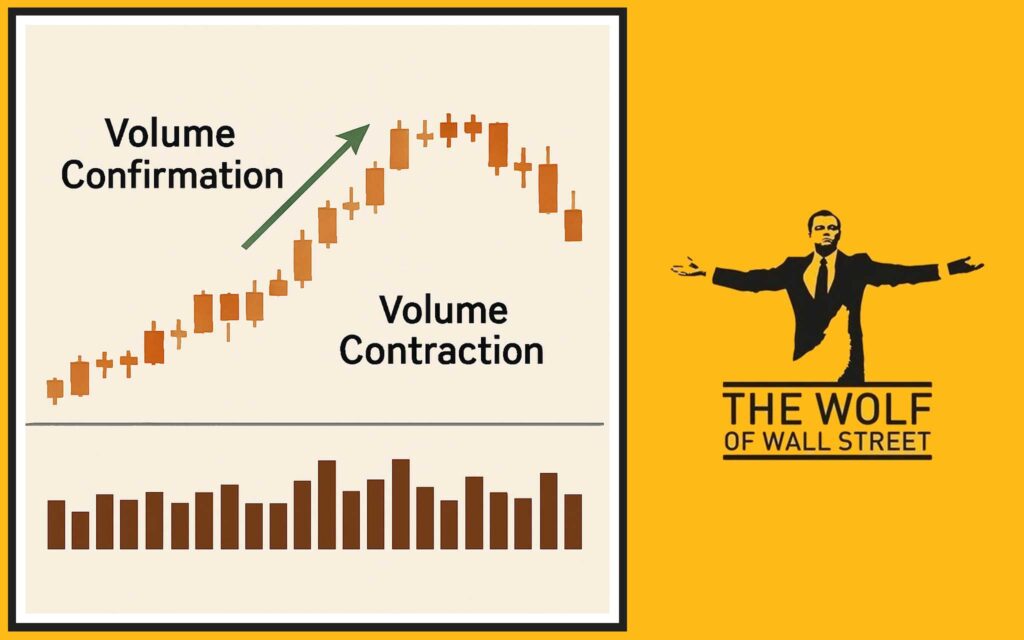
Dow Theory also incorporates trading volume as a confirmation tool. The principle is that volume should increase when price moves in the direction of the primary trend and decrease when price moves against the primary trend.
- In an uptrend, volume should increase on rallies (moves up) and decrease on pullbacks (moves down).
- In a downtrend, volume should increase on declines (moves down) and decrease on rallies (moves up).
Strong volume confirming the trend’s direction adds conviction to the price movement. Low volume on a price move in the trend direction might suggest weakness.
Trends Persist Until a Clear Signal Reverses Them
This tenet reflects the idea of market inertia. A primary trend is assumed to remain in effect until there is clear, unmistakable evidence that a reversal has occurred. Dow Theory looks for specific signals, particularly the failure of the peak-and-trough pattern in both confirming averages, to identify these reversals. You don’t assume a trend has ended just because of a short-term move against it; you wait for the definitive signals.
📉📈 Peak-and-Trough Analysis: Spotting Trend Reversals
This is the practical method Dow Theory uses to identify when a trend might be changing. It involves looking at the sequence of price peaks (highs) and troughs (lows) on a chart.
Identifying Uptrends
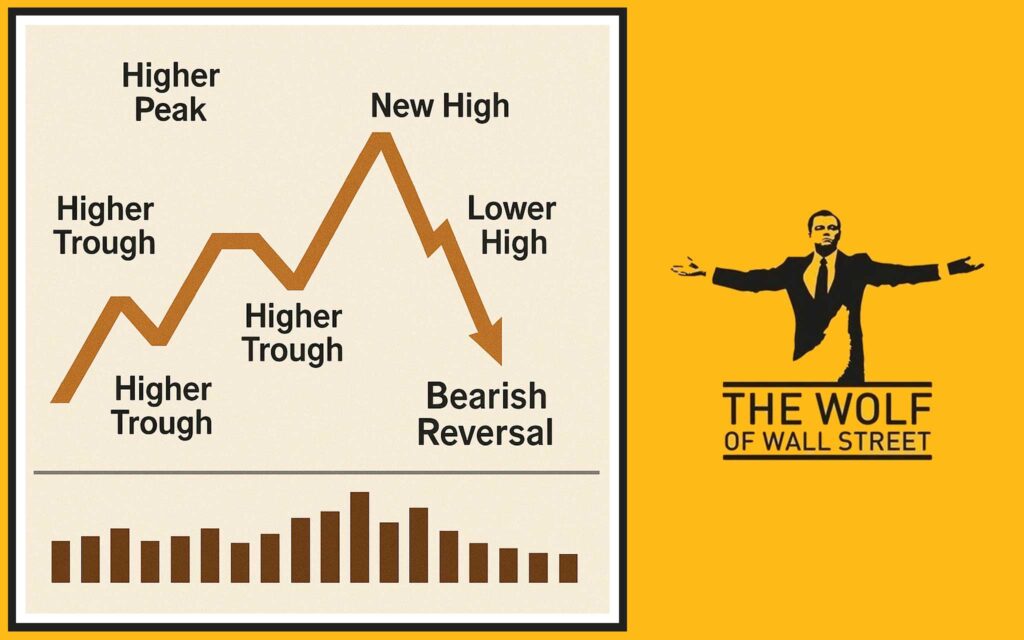
An uptrend is defined by a series of successively higher peaks and successively higher troughs. Price makes a high, pulls back to a low, then rallies to a new high above the previous high, and pulls back to a new low above the previous low. This pattern of “higher highs” and “higher lows” confirms the upward trend.
Identifying Downtrends
A downtrend is defined by a series of successively lower peaks and successively lower troughs. Price makes a low, rallies to a high, then falls to a new low below the previous low, and rallies to a new high below the previous high. This pattern of “lower highs” and “lower lows” confirms the downward trend.
What Happens When the Pattern Breaks
A potential trend reversal is signalled when the market fails to continue this pattern.
- In an uptrend, a reversal is signalled if the market fails to make a new higher high, and then falls below the level of the previous swing trough (the most recent higher low). This break below the previous low suggests sellers are gaining control.
- In a downtrend, a reversal is signalled if the market fails to make a new lower low, and then rallies above the level of the previous swing peak (the most recent lower high). This break above the previous high suggests buyers are gaining control.
According to Dow Theory, a confirmed primary trend reversal signal occurs when this peak-and-trough pattern breaks in both the confirming averages.
📊 “Line Ranges”: Consolidation Before the Breakout
Sometimes, instead of trending clearly, the market moves sideways in what Dow Theory calls a “line range” or consolidation zone.
Recognising Consolidation Zones
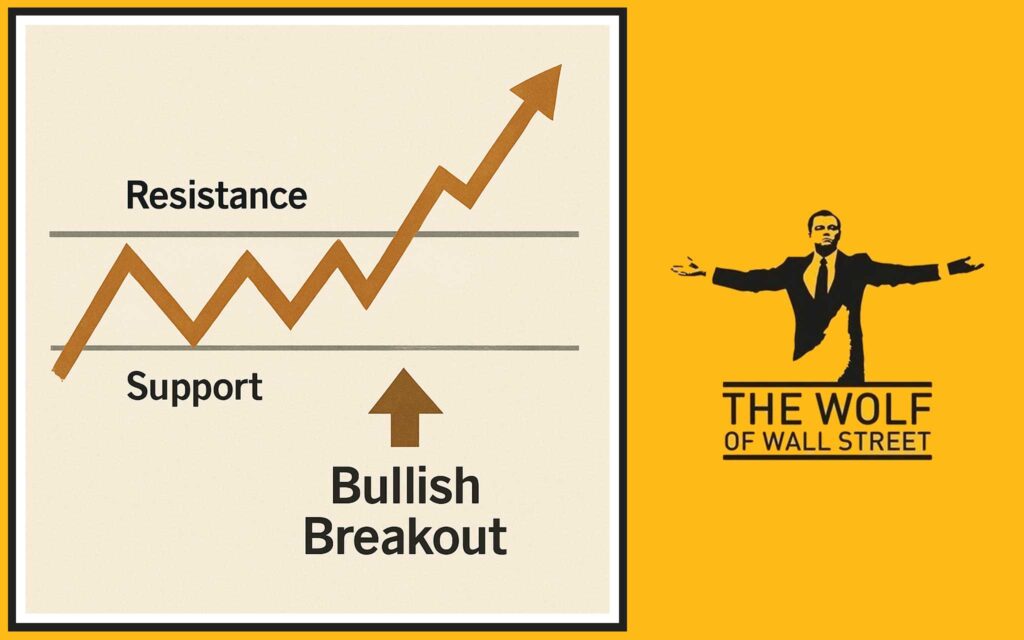
These are periods where price trades horizontally within a relatively narrow range, bounded by clear support (the lows of the range) and resistance (the highs of the range). Price might oscillate within this range for weeks or months.
Breaks from Line Ranges Confirming Trends
Line ranges are seen as periods of accumulation or distribution. A sustained price move decisively breaking out of the range confirms the direction of the next significant move.
- A break above the resistance of a line range is typically a bullish signal, confirming the resumption of an uptrend or the start of a new one.
- A break below the support of a line range is typically a bearish signal, confirming the resumption of a downtrend or the start of a new one.
These breakouts should ideally be confirmed by increasing volume.
🧐 Dow Theory Today: Relevance and Critiques
Despite its age, Dow Theory remains relevant because its core principles about trend behaviour, confirmation, and the psychology reflected in market averages are still applicable.
Strengths in Identifying Major Trends
Dow Theory provides a powerful framework for focusing on the big picture and avoiding getting lost in short-term market noise. It helps traders identify and ride major primary trends, which is where the most substantial profits can be made. Its emphasis on confirmation adds a layer of caution, reducing the likelihood of acting on false signals.
Limitations
However, Dow Theory is not without its critics and limitations in modern markets:
- Lagging Nature: This is the most significant criticism. Because signals require confirmation (often from two averages and volume), they typically occur well after a new trend or reversal has already begun. This means traders using Dow Theory might miss the early, high-momentum phase of a move.
- Reduced Transportation Significance: The DJTA, focused on rail and transport companies, holds less relative importance in today’s service-based and digital economy compared to its role in Dow’s time. Many analysts use broader indices like the S\&P 500 or Nasdaq, or different sector indices for confirmation.
- Subjectivity: Identifying what constitutes a “significant” peak or trough, or determining the boundaries of a primary trend or line range, can involve a degree of subjective judgment.
How the Theory Has Influenced Modern Technical Analysis
Despite limitations, Dow Theory’s influence is undeniable. Its concepts of trend types, phases, confirmation, and peak-and-trough analysis form the basis of many modern charting techniques and indicators. The idea that markets discount everything is a fundamental tenet of technical analysis today.
🤝 Using Dow Principles with Modern Tools
Few traders rely solely on Dow Theory today. Its greatest value is as a guiding framework used in conjunction with modern technical analysis tools to enhance signal reliability and provide context.
Dow Trends and Moving Averages
You can use Moving Averages (like the 50-day or 200-day MA) to confirm the direction and potential phases identified by Dow Theory. An MA slope aligning with a Dow primary trend or crossovers of MAs confirming a peak-and-trough reversal signal adds strength to your analysis (linking to Moving Averages Article).
Dow Principles and Trendlines
Drawing Trendlines on your charts can visually reinforce the peaks and troughs you identify in a Dow Theory analysis, making the trend structure and potential break points clearer (linking to Trendlines Article).
Dow Theory and Volume Analysis
Modern volume indicators provide more sophisticated ways to confirm the volume tenet of Dow Theory, helping you see if increasing volume is truly supporting moves in the direction of the primary trend.
Using Dow Principles for Context with Other Indicators
Identify the primary trend and its phase using Dow principles, and then apply shorter-term trading strategies using indicators like MACD, RSI, or Bollinger Bands, or pattern analysis tools like Fibonacci or Elliott Wave, within that larger context (linking to MACD Article, RSI Article, Bollinger Bands Article, Fibonacci Article, Elliott Wave Theory Article). For instance, in a confirmed Dow primary uptrend, you’d favour bullish signals from other indicators and treat bearish signals as potential short-term pullbacks rather than major reversals until Dow Theory gives a reversal signal.
Understanding these different technical tools is part of building a solid foundation in trading, especially in dynamic digital asset markets discussed in resources on Cryptocurrencies. For anyone starting out, exploring resources that provide solid Trading Insights is a smart move. Beginners should focus on grasping the basics first, as explained in guides for Newbie traders.
⏱️ The Lagging Nature: Understanding Confirmation’s Price

Let’s be clear about the trade-off with Dow Theory: confirmation means waiting.
Why Confirmation Means Waiting
You need to see signals confirmed across multiple averages and potentially by volume. You need to see a clear break of the peak-and-trough pattern in both averages. This process takes time. By the time all conditions are met for a confirmed Dow Theory signal, the market has often already moved significantly from the absolute top or bottom.
Implications for Entry/Exit Timing
Because of this lag, Dow Theory is less suited for precise, short-term entry and exit timing. Its strength lies in confirming that a major trend is in place or that a major reversal has likely occurred. Traders often use faster, more responsive tools for timing trades within the context of the major trend identified by Dow principles.
Frequently Asked Questions (FAQs)
- Who was Charles H. Dow and what is his significance?
Charles H. Dow was a co-founder of Dow Jones & Company and editor of The Wall Street Journal. His market observations laid the foundation for Dow Theory, a key framework in technical analysis. - What are the three types of market trends according to Dow Theory?
The three types are primary trends (long-term bull/bear markets), secondary trends (medium-term corrections/rallies), and minor trends (short-term noise). - What does “Market Averages Must Confirm Each Other” mean?
It means a trend signal in one major market index (like the DJIA) is not considered valid unless a similar signal is seen in another key index (originally the DJTA). - How does Dow Theory identify a potential trend reversal?
It identifies potential reversals through peak-and-trough analysis, specifically when the pattern of successively higher highs and lows (uptrend) or lower highs and lows (downtrend) is broken in the confirming averages. - Is Dow Theory a leading or lagging indicator?
Dow Theory is considered a lagging indicator because its confirmation signals occur after a trend or reversal has already begun.
There you have it – Dow Theory, the timeless framework that teaches you to see the forest, not just the trees, and understand the big moves that truly shape the market.

“The Wolf Of Wall Street crypto trading community offers a comprehensive platform for navigating the volatile cryptocurrency market. Here’s what you gain:
- Exclusive VIP Signals: Access proprietary signals designed to maximize trading profits.
- Expert Market Analysis: Benefit from in-depth analysis from seasoned crypto traders.
- Private Community: Join a network of over 100,000 like-minded individuals for shared insights and support.
- Essential Trading Tools: Utilize volume calculators and other resources to make informed decisions.
- 24/7 Support: Receive continuous assistance from our dedicated support team.
Empower your crypto trading journey:
- Visit our website: https://tthewolfofwallstreet.com/ for detailed information.
- Join our active Telegram community: https://t.me/tthewolfofwallstreet for real-time updates and discussions.
- Unlock your potential to profit in the crypto market with “The Wolf Of Wall Street””