Making profit in markets comes down to having the right tools and knowing how to use them. One fundamental tool any serious trader should grasp is Bollinger Bands. These aren’t just lines on a chart; they show you market volatility and point towards moments where big moves could be starting or ending. Get this right, and you put yourself in a position to make money.
📈 The Genesis of Bollinger Bands
John Bollinger brought this indicator to the trading world in the 1980s. He saw a need for a tool that didn’t just follow price trends but also reacted to how much price was jumping around – market volatility. Traditional indicators often failed in shifting volatility environments. Bollinger’s goal was to create something dynamic, something that adapted to whether the market was calm or going wild.
The main purpose? To give traders a relative definition of high and low prices. What’s considered ‘high’ or ‘low’ changes depending on how volatile the market is. Bollinger Bands adjust to this, providing a clearer picture than static percentage bands ever could. For anyone serious about their trading outcome, grasping this fundamental concept is vital. It’s about understanding the market’s pulse.
🤔 Breaking Down the Bands
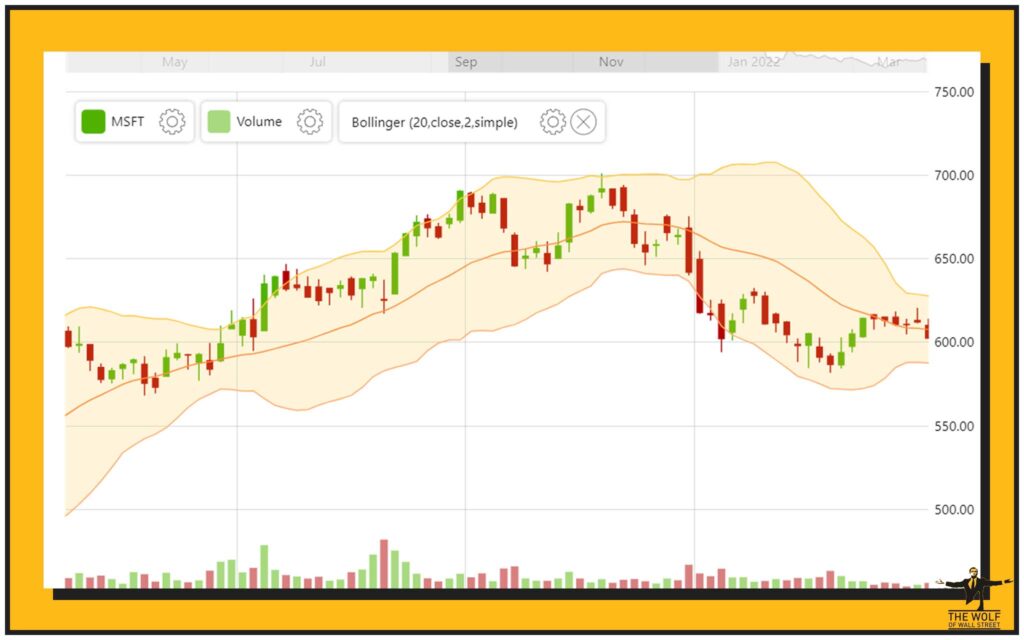
So, what are these bands actually made of? It’s simple math, but it’s powerful when applied correctly. Bollinger Bands consist of three lines plotted on a price chart:
The Middle Band: How the simple moving average tracks the trend.
- This is typically a 20-period simple moving average (SMA). Think of it as the market’s average price over the last 20 price bars (whether those are minutes, hours, or days). It shows you the short-term trend direction. Price often tends to revert to this middle line.
- Common settings for the simple moving average are 20 periods, but traders can adjust this. A shorter period makes it more reactive; a longer period makes it smoother.
- This middle line acts like a dynamic centre of gravity for the price. It frequently serves as a support level when price is above it, or a resistance level when price is below it. Watching how price interacts with this line after touching an outer band is key.
The Outer Bands: How standard deviation quantifies price dispersion.
- These are the critical parts that show volatility. They are plotted two standard deviations away from the middle band. One band is two standard deviations above the SMA, and the other is two standard deviations below the SMA.
- Standard deviation is a statistical measure of dispersion – how spread out the numbers are from their average. In trading, it tells you how much price is deviating from its average movement.
- Using two standard deviations means that statistically, about 95% of price action is expected to occur within these two bands. When price goes outside them, it’s a statistically rare event, often indicating an extreme price level relative to recent movement.
Understanding these components is non-negotiable. They aren’t arbitrary lines; they are statistical measures reflecting market behaviour. For those serious about trading cryptocurrency, where volatility can be intense, getting a handle on how these bands quantify that movement is your first step. You can find more information on basic trading analysis techniques in resources dedicated to Trading Insights.
📊 Seeing Market Volatility Clearly
This is where the magic happens. The distance between the outer bands directly reflects market volatility.
Bands Expanding: What wider bands signal about volatility levels.
- When the outer bands widen, pulling away from the middle band, it means volatility is increasing. Price is moving more dramatically, and swings are larger. This often happens during strong trend moves or significant news events.
- Wider bands indicate a period where price is covering a larger range.
- Increased trading activity often accompanies expanding bands as more participants enter the market.
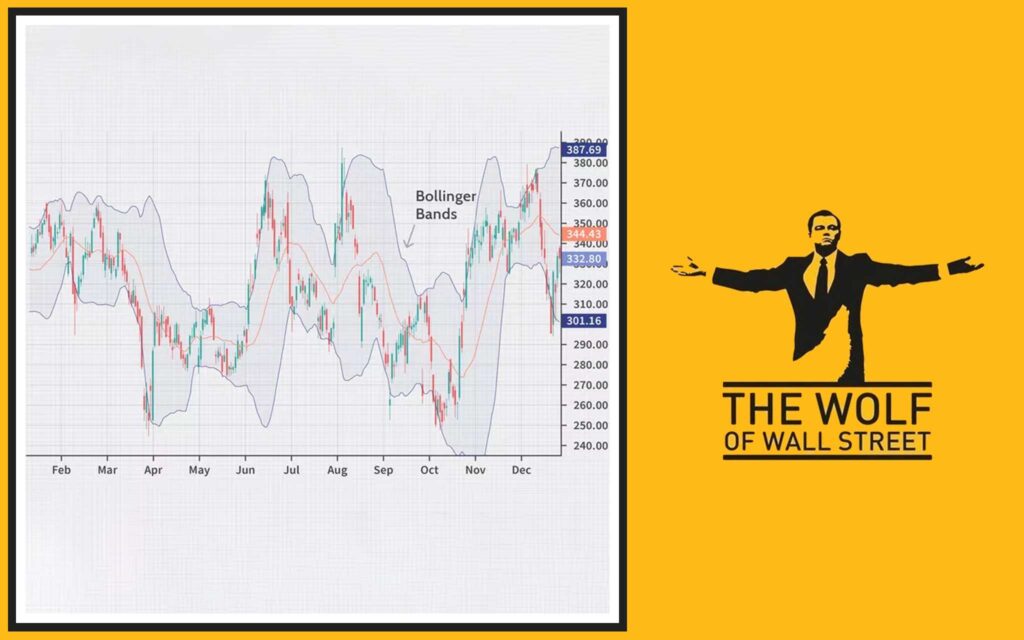
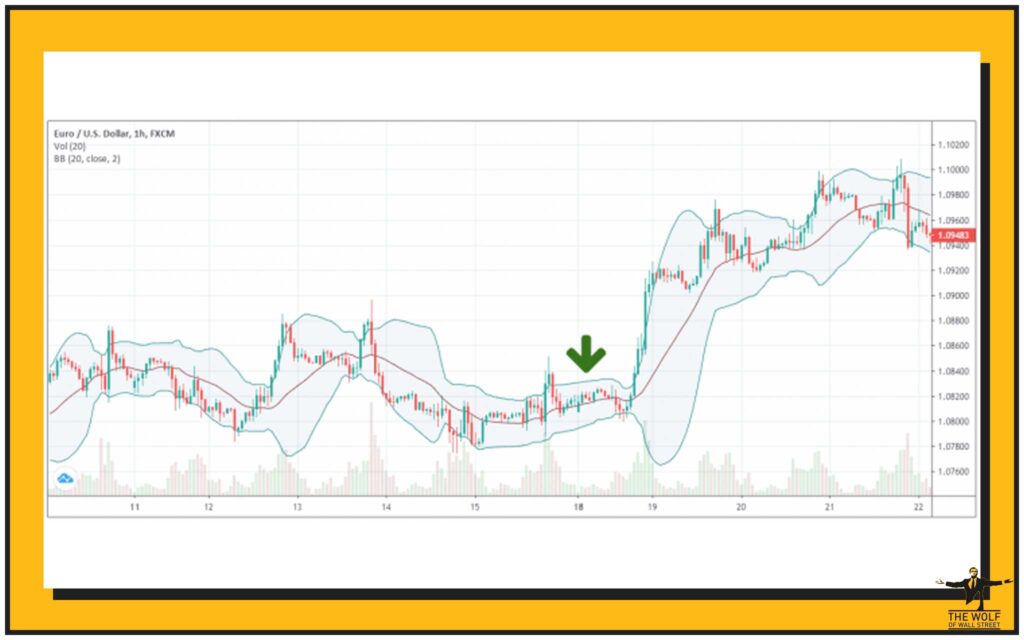
Bands Contracting: What tighter bands indicate – the “squeeze.”
- When the outer bands move closer together, squeezing towards the middle band, it tells you volatility is decreasing. Price swings are smaller, and the market is consolidating or moving sideways. This tightening is often called the “Bollinger Band Squeeze.”
- Tighter bands mean price is trading in a narrower range.
- A tight squeeze is frequently a precursor to a significant price move – a breakout is likely coming, but the direction isn’t yet certain from the bands alone.
Recognising when the bands are expanding or contracting is fundamental. Expanding bands mean ride the wave; contracting bands mean get ready for the next move.
👀 Decoding Price Signals from the Bands
How price interacts with these bands provides valuable signals. It’s about relative price levels.
Price Reaching the Upper Band: Why this can suggest conditions are getting extended to the upside.
- When the price hits or moves outside the upper band, it suggests the asset may be overbought or has reached an extreme high relative to its recent average movement and volatility. It’s not an automatic sell signal, but it’s a warning sign to look for other confirmation of a potential reversal or pullback.
Price Reaching the Lower Band: Conversely, when price touches or moves outside the lower band, it suggests the asset may be oversold or has reached an extreme low. Again, not an automatic buy signal, but a prompt to look for other signs that price might bounce or reverse upwards.
Price Crossing the Middle Band: Signalling possible trend shifts or continuations.
- A move across the 20-period SMA can signal a shift in the short-term trend. If price crosses above the middle band, it can suggest the buyers are gaining control. If it crosses below, it might mean sellers are taking over.
These aren’t rigid rules, but probabilities. Price can ride the upper or lower band in a strong trend for extended periods. This is why context and confirmation from other tools are vital. For those new to markets, understanding these basic interactions is a solid start. More guidance for newcomers can be found in resources for Newbie traders.
✅ Putting Bands to Work: Strategies That Deliver
Now, let’s talk about making money with these things. There are specific ways traders use Bollinger Bands.
The Bollinger Bounce: Trading price reversals as they tag the outer bands.
- This strategy is based on the observation that price often reverts to the middle band after touching one of the outer bands.
- To identify a bounce setup, look for price touching or briefly piercing an outer band and then showing signs of reversal (like a candlestick pattern).
- Entry could be initiated as price moves back inside the band or confirms a reversal pattern. The middle band often serves as a target, and the opposite outer band could be a more ambitious target in some cases. Stops are placed outside the band that was touched.
Trading the Squeeze: Positioning for a breakout after volatility contracts.
- This strategy anticipates a breakout after a period of low volatility.
- Recognise a tight squeeze when the bands are very narrow and flat. This market is coiled and ready to move.
- Entry comes on the breakout – when price starts moving impulsively and the bands begin to widen in that direction. Trading the squeeze requires patience, waiting for confirmation of the breakout direction before acting.
Confirming Breakouts: Using band expansion to validate price moves out of a range.
- When price breaks above a resistance level or below a support level, Bollinger Bands can help confirm if the move has strength.
- If price breaks out and the bands simultaneously expand rapidly in the direction of the breakout, it adds weight to the idea that the move is genuine and has momentum. A breakout on contracting or static bands is more suspicious.
These strategies require practice and discipline. They aren’t foolproof, but they give you concrete ways to use the information the bands provide. Applying these strategies requires understanding market behaviour across different asset classes, including digital ones covered in Cryptocurrencies.
🛠️ Adding Power: Combining Bands with Other Indicators
Bollinger Bands are good, but they’re better when used with other tools. Think of it like having multiple sources of information telling you the same thing – that builds conviction.
Bollinger Bands and RSI: Using momentum to confirm overbought/oversold calls.
- The Relative Strength Index (RSI) is a momentum oscillator that shows if an asset is overbought or oversold, typically on a scale of 0 to 100.
- If price hits the upper Bollinger Band and the RSI is showing overbought conditions (usually above 70), that’s a stronger signal for a potential downside reversal or pullback than just the Bollinger Band signal alone.
- Conversely, if price hits the lower Bollinger Band and the RSI is showing oversold conditions (usually below 30), it strengthens the case for a potential bounce or upside reversal.
Bollinger Bands and MACD: Checking trend direction and strength alongside band signals.
- The Moving Average Convergence Divergence (MACD) is another trend-following momentum indicator. It shows the relationship between two moving averages of a price and provides buy/sell signals based on their crossovers.
- Using MACD to confirm the trend direction indicated by the Bollinger Bands can be effective. For example, if price crosses above the middle band and MACD gives a bullish crossover, it’s a stronger signal of potential upside movement.
- MACD can also help confirm breakout direction during a Bollinger Band squeeze. If price breaks higher from a squeeze and MACD confirms upward momentum, the probability of a successful upside breakout increases.
Combining indicators isn’t about cluttering your chart; it’s about building confluence – getting multiple tools to agree before you take action.
🛑 Avoiding Common Trading Traps
Even the best tools can be misused. With Bollinger Bands, there are specific traps to watch out for.
False Breakouts: When a squeeze fails.
- This happens when price seems to break out from a squeeze or a trading range, the bands start to widen, but the move quickly fails, and price snaps back inside the bands or range. This can lead to losing trades if you jump in too early or without confirmation. Using other indicators or waiting for candle closes outside the bands can help filter these.
Challenges in Strong Trends: Prices staying outside bands.
- In a powerful trend, price can ‘walk’ the upper or lower band for a long time without reverting to the middle. If you purely trade the ‘bounce’ signal without respecting the strong trend, you can get chopped up or miss the main move. Understanding the overall market trend is key here.
Incorrect Settings: Using parameters not suited to the asset.
- Using the default 20-period, 2 standard deviation setting might not be optimal for every asset or every trading style. A very volatile asset might require a higher standard deviation (like 2.5 or 3) to contain more price action. A slower-moving asset might work better with a different period setting. Using inappropriate settings can generate too many false signals or miss good opportunities. Experimentation and backtesting on the specific asset you trade are vital.
Being aware of these potential issues is crucial. Trading isn’t just about finding signals; it’s about managing risk and avoiding costly errors.
⚙️ Making Bands Work for Any Asset
Bollinger Bands are versatile. They work on stocks, forex, commodities, and yes, digital assets like Bitcoin and Altcoins. But you might need to tweak them.
Adjusting the lookback period (the number of periods for the simple moving average) changes how quickly the bands react to price changes. A shorter period (e.g., 10) makes the bands tighter and more responsive, generating more signals. A longer period (e.g., 50) makes them wider and smoother, generating fewer signals, but potentially more reliable ones in longer timeframes.
Modifying the standard deviation multiplier changes how far the bands are plotted from the middle line. Using 1 standard deviation keeps about 68% of price action within the bands, generating many signals but also many false ones. Using 3 standard deviations keeps about 99.7% of price action within the bands, generating very few signals, typically only during extreme moves. The standard 2 works for many markets, but testing other values is recommended for specific assets. Understanding the price characteristics of assets, like Bitcoin or various Altcoins, found in sections dedicated to Cryptocurrencies can help in selecting appropriate settings.
Frequently Asked Questions (FAQs)
- What is the primary purpose of Bollinger Bands?
Their main purpose is to measure market volatility and provide a relative definition of high and low prices for an asset over a specific period. - How are the outer bands calculated?
The outer bands are typically plotted two standard deviations above and below the middle band (a simple moving average). Standard deviation measures how spread out prices are. - Does price always reverse when it hits the outer bands?
No. While touching the outer bands can indicate overbought or oversold conditions, price can ‘walk’ the bands in a strong trend. Confirmation from other indicators is necessary. - What does a “Bollinger Band Squeeze” indicate?
A squeeze, where the bands contract, indicates a period of low volatility which often precedes a significant price move or breakout. - Can Bollinger Bands be used alone for trading signals?
While they provide valuable signals, it is generally recommended to use Bollinger Bands in conjunction with other technical indicators or analysis methods for confirmation to reduce false signals.
And there you have it – how Bollinger Bands can be a key part of your trading arsenal.
The Wolf Of Wall Street crypto trading community offers a comprehensive platform for navigating the volatile cryptocurrency market. Here’s what you gain:
- Exclusive VIP Signals: Access proprietary signals designed to maximize trading profits.
- Expert Market Analysis: Benefit from in-depth analysis from seasoned crypto traders.
- Private Community: Join a network of over 100,000 like-minded individuals for shared insights and support.
- Essential Trading Tools: Utilize volume calculators and other resources to make informed decisions.
- 24/7 Support: Receive continuous assistance from our dedicated support team.
Empower your crypto trading journey:
- Visit our website: https://tthewolfofwallstreet.com/ for detailed information.
- Join our active Telegram community: https://t.me/tthewolfofwallstreet for real-time updates and discussions.
- Unlock your potential to profit in the crypto market with “The Wolf Of Wall Street”