Understanding the key macroeconomic indicators affecting crypto is the single biggest difference between amateur gamblers and professional predators in this market. Let’s get one thing straight. The reason you’re not driving a Lamborghini isn’t “bad luck.” It’s because you’re playing checkers while the whales are playing 3D chess. You’re staring at one-minute charts, getting chopped to pieces by algorithms, while the real money is being moved by colossal forces you don’t even see. This article is your key to the war room, your entry pass into the minds of the people who actually move the market.

We’re going to dissect, piece by piece, the eight critical macroeconomic indicators that dictate the flow of capital into and out of the cryptocurrency market. This isn’t some boring university lecture; this is battlefield intelligence. Master these, and you’ll stop reacting to the market and start anticipating its every move. You will see the tidal waves forming while everyone else is still splashing around in the kiddy pool, waiting to get wiped out. Forget the noise on Twitter; this is the signal.
📈 FED Interest Rates: The Puppet Master of Capital
Forget the convoluted definitions they feed you on financial news channels. Federal Reserve interest rates are, quite simply, the cost of borrowing money in the world’s largest economy. When rates are low, money is cheap. It’s a party. Corporations, hedge funds, and every degenerate with a pulse can borrow for pennies on the dollar and plough that cash into high-risk, high-reward assets. And what’s the ultimate high-risk, high-reward asset class? You got it: crypto.
Think of it like an open bar. When the drinks are free, everyone is pounding shots. When the Fed cuts rates, they’re yelling “drinks are on the house!” A tsunami of cheap money floods the system, desperately searching for a return. It pours into stocks, real estate, and most importantly for us, it sends Bitcoin and the altcoin market into the stratosphere.
But when the party gets too wild, the Fed becomes the fun police. They hike rates. Money is no longer cheap. The cost of borrowing skyrockets, and that ocean of capital recedes faster than the tide. The money flees back to the safety of government bonds where it can earn a risk-free return. For crypto, this is a death sentence. The open bar is closed, the lights are on, and the hangover is brutal. Your only job is to watch the bartender—the Fed. Their every word, every hint, every raised eyebrow dictates the flow of capital. They are the puppet masters, and the market is their puppet.
🛒 The PCE Index: The FED’s Favourite Toy
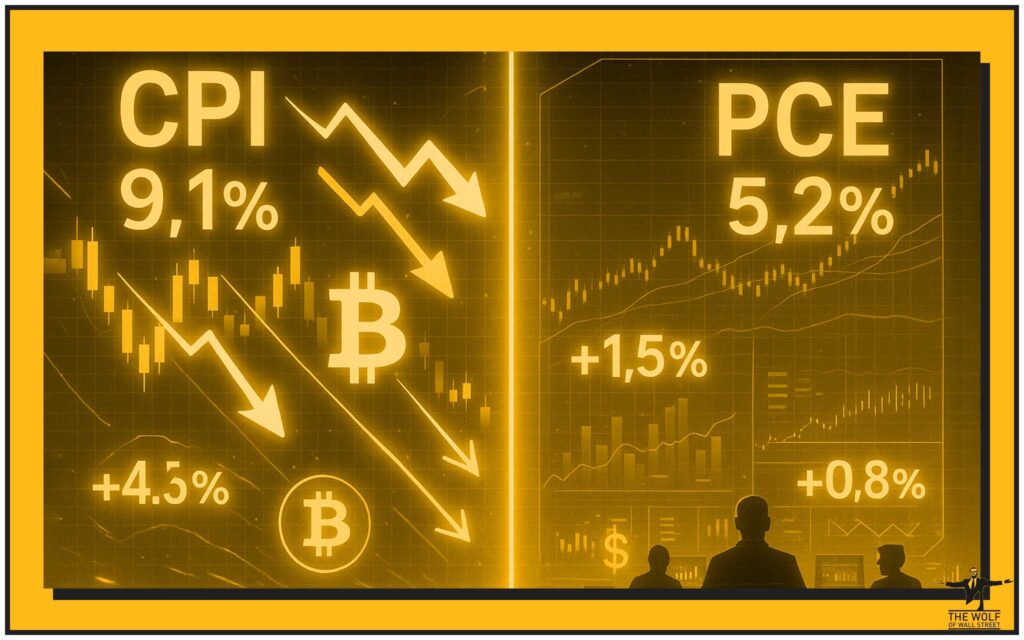
While all the retail clowns and news anchors are hyperventilating over the CPI number, the real sharks, the institutional money, are watching the Personal Consumption Expenditures (PCE) index. This is the Federal Reserve’s preferred inflation gauge. Why? Because it’s a more comprehensive and adaptable measure of what people are actually spending their money on. It tells the Fed if the economy is running too hot.
If this number comes in high, it’s a warning shot across the bow. It tells you that the Fed is getting nervous. They see inflation as a dragon they need to slay, and their only weapon is the interest rate hammer. A hot PCE reading means that hammer is likely coming down, and rate hikes are firmly on the table. For crypto, that’s like hearing footsteps in a dark alley—it’s rarely good news.
Conversely, a cool or declining PCE reading gives the Fed room to breathe. It means their plan is working, and they can ease off the tightening. It might even open the door for future rate cuts. That is your green light. It’s the signal that the risk-on environment that fuels crypto bull runs could be just around the corner. Stop watching what everyone else is watching. Watch what the Fed watches.
🏷️ The CPI Index: The Public’s Volatility Machine

Now, just because the PCE is the Fed’s favourite doesn’t mean you can ignore the Consumer Price Index (CPI). The CPI is the headline-grabber, the number that creates instant, gut-wrenching volatility. Why? Because the entire world of algorithmic trading bots and degenerate gamblers is programmed to react to it instantly. The moment the number drops, billions of dollars are moved in microseconds, often creating massive fake-outs designed to liquidate over-leveraged fools.
My advice to you? Don’t be a hero. Trying to trade the exact moment of the CPI release is like trying to catch a falling knife in the dark. You will get hurt. The initial move is almost always a trap designed to wipe out both longs and shorts. The smart money, the real wolves, wait for the dust to settle. They let the amateurs slaughter each other, and then they step in to trade the real, sustainable trend that emerges in the hours and days that follow. Use the CPI release not as a trading signal, but as a catalyst that creates the opportunities you’ve been waiting for. For more on spotting these larger movements, understanding the basics of Dow Theory for market trend analysis is non-negotiable.
🏭 Gross Domestic Product (GDP): The Economy’s Scorecard
Gross Domestic Product is the ultimate scorecard for the economy. It’s the total value of everything produced. A rising GDP means the economy is firing on all cylinders. Companies are crushing earnings, people have jobs and disposable income, and their appetite for risk is growing. They feel wealthy, so they take a punt on more speculative assets. That’s when you see money flow into altcoins and NFTs.
A shrinking GDP, on the other hand, signals a recession. Fear grips the market. People lose their jobs, businesses fold, and survival becomes the priority. Cash becomes king. Investors dump everything that isn’t nailed down, starting with the riskiest assets first. Crypto gets hit, and it gets hit hard. But don’t just look at the headline number. Is the growth coming from genuine innovation and productivity, or is it just the government printing money and spending it? Strong, organic economic growth is profoundly bullish for crypto in the long term.
💼 Non-Farm Payrolls (NFP): The Ultimate Health Check
Released on the first Friday of every month, the NFP report is a snapshot of the US job market. It tells you how many jobs were added or lost, excluding farm workers, and it’s a direct line into the Fed’s brain. A red-hot NFP number shows the economy is strong—perhaps too strong. It gives the Fed the justification it needs to keep interest rates high, or even raise them further, to stamp out any lingering inflation. That’s bearish for crypto.
A weak or negative NFP number, however, is a massive red flag for the economy. It signals that cracks are appearing and a recession might be looming. This forces the Fed’s hand. They can’t keep hiking rates into a collapsing job market. They have to pivot, to consider cutting rates and turning on the money printers again. For the average person, a weak jobs report is bad news. For a crypto trader who understands the game, bad news is good news. It’s the signal that stimulus is coming.
📉 Unemployment Claims: The Canary in the Coal Mine

While NFP gives you a powerful monthly overview, the weekly unemployment claims report is your early warning system. This is high-frequency data that can signal a turn in the economy long before it shows up in the GDP or NFP figures. Think of it as the canary in the coal mine. When you see a sudden, sustained spike in the number of people filing for unemployment benefits, it means the job market is starting to crumble.
This is your forward-looking indicator. It tells you what’s likely to happen next. As claims rise, the pressure on the Fed to pivot and loosen monetary policy intensifies. You can see the turn coming weeks or even months in advance. While everyone else is reacting to old news in the monthly reports, you’re already positioned for the Fed’s next move. This is how you get ahead of the herd.
💵 Money Supply (M2): The Fuel for the Fire
This is one of the most powerful yet overlooked indicators. M2 is a broad measure of the total amount of money circulating in the economy. When governments and central banks respond to a crisis by printing trillions of dollars (think 2020), that money has to go somewhere. It’s pure rocket fuel for asset prices. An expanding M2 is the tide that lifts all boats, but it sends the small, leaky, and exciting crypto dinghies into orbit.
The effect isn’t instant. There’s a lag of about 6-12 months as that new liquidity works its way through the financial system. But make no mistake, the correlation is undeniable. If you see M2 supply expanding aggressively, it is almost a mathematical certainty that a crypto bull run is on the horizon. Conversely, when M2 contracts or flattens, the fuel is being drained from the market. It signals a crypto winter is coming. Track this chart religiously.
💲 The USD Strength Index (DXY): Bitcoin’s Kryptonite
The DXY measures the value of the US dollar against a basket of other major world currencies. The relationship between the DXY and Bitcoin is beautifully simple: they are negatively correlated. They are on opposite ends of a seesaw. When the dollar gets stronger (DXY goes up), it acts as a black hole, sucking capital out of all other assets, including crypto. It takes fewer strong dollars to buy one Bitcoin, so its price falls.
When the dollar gets weaker (DXY goes down), investors flee from the dollar and seek refuge in other assets. They buy Euros, Yen, gold, and of course, Bitcoin. A falling DXY is a massive tailwind for the entire crypto market. If you are thinking of going long on crypto, but the DXY chart is in a screaming uptrend, you are fighting the market. You’re trying to swim up a waterfall. A smart trader waits for the DXY to show signs of weakness and rolls over. Then, and only then, do you strike.
🐺 The Wolf’s Final Word: Stop Guessing, Start Winning
Listen, I’ve just handed you the blueprints to the financial machine. These indicators are your new weapons. But knowing how a rifle works and being a world-class sniper are two completely different things. The market is a war zone, filled with landmines, fake-outs, and sophisticated algorithms designed to hunt your stop-losses and liquidate your accounts. Never, ever trade the news release itself. Let the amateurs and the bots fight it out and get slaughtered, then you step in with a clear head and execute your plan.
You now possess the intelligence that 99% of the market lacks. You understand the levers that move billions, even trillions, of dollars. The question is, what are you going to do about it? Information without action is worthless. You can have the best map in the world, but it’s useless if you don’t have the guts to step onto the battlefield. This is where the real work begins. To truly dominate, you need more than just a map; you need a team of seasoned generals guiding you.
That’s where the The Wolf Of Wall Street crypto trading community comes in. We provide the environment to turn this knowledge into profit. With our Exclusive VIP Signals, you get proprietary intel designed to maximise your gains. Our team of seasoned traders provides Expert Market Analysis to help you navigate the chaos. You’ll join a private network of over 100,000 like-minded wolves, sharing insights and strategies. We arm you with essential tools and provide 24/7 support. Stop trying to do this alone.

Visit our service at https://tthewolfofwallstreet.com/service and join our active Telegram community at https://t.me/tthewolfofwallstreet. It’s time to stop being the sheep and start being the wolf by understanding the crucial macroeconomic indicators affecting crypto.
❓ Frequently Asked Questions (FAQs)
1. Which single macroeconomic indicator is the most important for crypto?
There is no single “most important” indicator; it’s about the confluence. However, if you put a gun to my head, it would be FED Interest Rates. They dictate the cost of money itself, which is the ultimate driver of capital flows into risk assets like crypto. Everything else, from CPI to NFP, is just data the Fed uses to decide on rates.
2. How often should I be checking these indicators?
Some are weekly (Unemployment Claims), most are monthly (CPI, NFP, PCE). GDP is quarterly, and M2/DXY are continuous trends. You don’t need to stare at them daily. Set alerts for the release dates of the monthly reports and review the longer-term trends of DXY and M2 on a weekly basis. The goal is to understand the macro environment, not to day-trade the news releases.
3. Can I be a successful crypto trader by just using technical analysis and ignoring macro?
You can be successful for a while, especially in a clear bull market where everything goes up. But you will get absolutely destroyed when the macro tide turns. Ignoring macro is like sailing a ship without looking at the weather forecast. You might be fine in calm seas, but when the hurricane comes—and it always comes—you will sink. True professionals use both technicals for their entries and exits, and macro for their overall strategic direction.