
Look, most people see market charts as chaos. Just random up and down. But that’s where they’re wrong. There’s structure. There are patterns. And understanding them? That’s how you pull profit out of thin air. We’re talking Elliott Wave Theory. This isn’t some crystal ball; it’s a way to understand the market’s pulse, its rhythm, and predict potential moves before they happen. It’s a powerful tool for anyone serious about making real money.
🌊 The Man Behind the Waves
So, who figured this out? A guy named Ralph Nelson Elliott. He wasn’t some wall street hotshot; he was an accountant back in the 1930s. He spent years—years—staring at price charts across different markets and timeframes. What he saw wasn’t random noise. He saw recurring patterns, specific structures that showed up again and again, regardless of whether he was looking at hourly stock prices or decades of index data.
His core observation? That markets move in repetitive sequences of waves, reflecting shifts in collective investor psychology. It’s about the crowd, the collective optimism and pessimism that drives prices. Elliott theorised that these patterns were consistent, measurable, and could be used to forecast future price action. For anyone trying to get ahead in trading, understanding this historical context helps you appreciate the depth of what Elliott uncovered.
🤔 Impulse and Correction: The Market’s Rhythm
At the heart of Elliott Wave Theory is the idea that market movement follows a basic two-pattern cycle: motive phases and corrective phases.
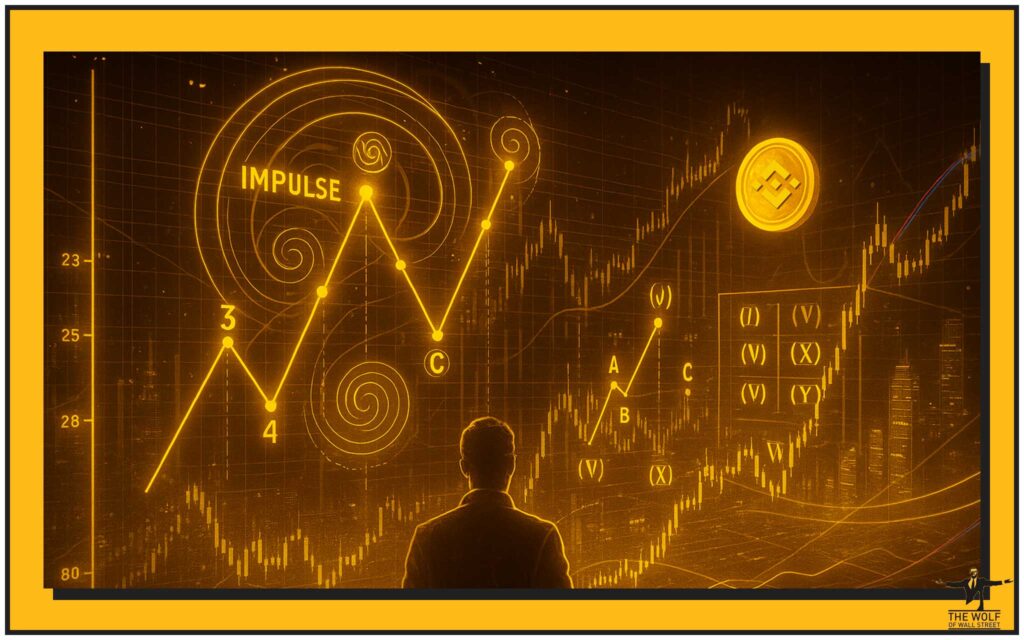
Motive waves (often called impulse waves) move in the direction of the larger trend. If the market is going up overall, the motive waves are the strong upward moves. If it’s trending down, the motive waves are the sharp declines. These waves typically consist of 5 sub-waves internally.
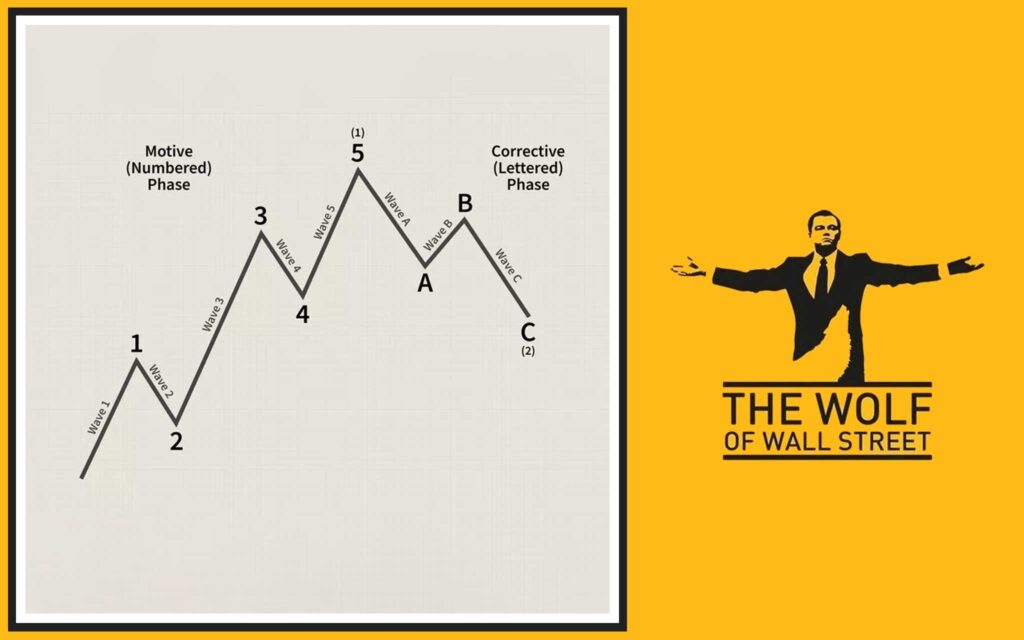
Corrective waves move against the direction of the larger trend. They are the pullbacks or rallies that interrupt the main move. If the market is trending up, corrective waves are the dips. If it’s trending down, they are the bounces. These waves typically consist of 3 sub-waves internally, or combinations of three.
Think of it like breathing. The market breathes in (impulse) and breathes out (correction), then breathes in again. Recognising which phase the market is in is the first step to using this theory effectively.
📈 Impulse Waves: Riding the Main Trend
The impulse wave is the money-making part of the cycle when you’re trading with the trend. It’s typically a 5-wave structure, labeled 1, 2, 3, 4, and 5.
- Wave 1: This is the initial move in the new trend direction. It can be hard to identify in real-time because many people still believe the old trend is in force. It’s often relatively short.
- Wave 2: This is the first pullback against Wave 1. It retraces some of the gains made in Wave 1. It’s a corrective wave (usually an A-B-C). The key rule here? Wave 2 must not retrace more than 100% of Wave 1’s price territory. If it does, your count is wrong.
- Wave 3: This is often the longest and strongest wave in the impulse sequence. It’s the wave where the majority of the market catches onto the new trend, and volume typically increases significantly. This wave cannot be the shortest among Waves 1, 3, and 5. It’s frequently a powerful, extended move.
- Wave 4: This is the second pullback, correcting Wave 3. Like Wave 2, it’s a corrective wave. The critical rule for Wave 4 in a standard impulse? It must not overlap the price territory of Wave 1. Its low (in an uptrend) or high (in a downtrend) must remain above the high (in an uptrend) or below the low (in a downtrend) of Wave 1.
- Wave 5: This is the final move in the direction of the impulse. It completes the 5-wave sequence. Wave 5 is often less dynamic than Wave 3, and volume might decrease compared to Wave 3, signalling the trend is tiring. After Wave 5 finishes, a larger corrective phase is expected.
These rules for impulse waves are absolutely fundamental. Break a rule, and your wave count is invalid. It forces discipline and objectivity in applying the theory.
Sometimes, an impulse wave can extend, meaning one of the impulse sub-waves (Wave 1, 3, or 5) is significantly longer than the others, often itself showing a 5-wave structure internally. Extensions usually happen in Wave 3, but Wave 1 or Wave 5 can also extend.
📉 Corrective Waves: Against the Flow
After a 5-wave impulse move, the market doesn’t just keep going forever. It corrects. These corrective waves move against the direction of the preceding impulse and are typically 3-wave structures, labeled A, B, and C. However, they are far more varied and complex than impulse waves.
The basic structure is simple:
- Wave A: The initial move against the trend.
- Wave B: A move back in the direction of the previous impulse (but against the correction’s overall direction). Wave B can sometimes retrace a significant portion of Wave A.
- Wave C: The final move to complete the correction, typically in the same direction as Wave A. Wave C is often a 5-wave impulse structure itself internally.
While the A-B-C is the core, corrective patterns come in many forms:
- Zigzags: The most common corrective pattern, a sharp A-B-C structure (5-3-5 sub-wave count). Wave A is a 5-wave impulse, Wave B is a 3-wave correction, and Wave C is a 5-wave impulse. They typically move strongly against the larger trend.
- Flats: Another 3-wave A-B-C, but with a 3-3-5 sub-wave count. Wave A is a 3-wave correction, Wave B is a 3-wave correction (often ending near the start of Wave A), and Wave C is a 5-wave impulse. Flats are sideways corrections.
- Triangles: Contracting or expanding sideways patterns, typically 5 waves labeled A, B, C, D, E, with a 3-wave structure internally for each leg (3-3-3-3-3). They occur within trends (often as Wave 4 or B waves) and represent periods of consolidation before the trend resumes in the direction it started before the triangle.
Corrective waves can also combine to form more complex structures like double or triple zigzags or flats, linked by ‘X’ waves. Because of their variety, identifying and counting corrective waves is significantly harder than counting impulse waves. This is where experience and checking your counts against the rules become crucial.
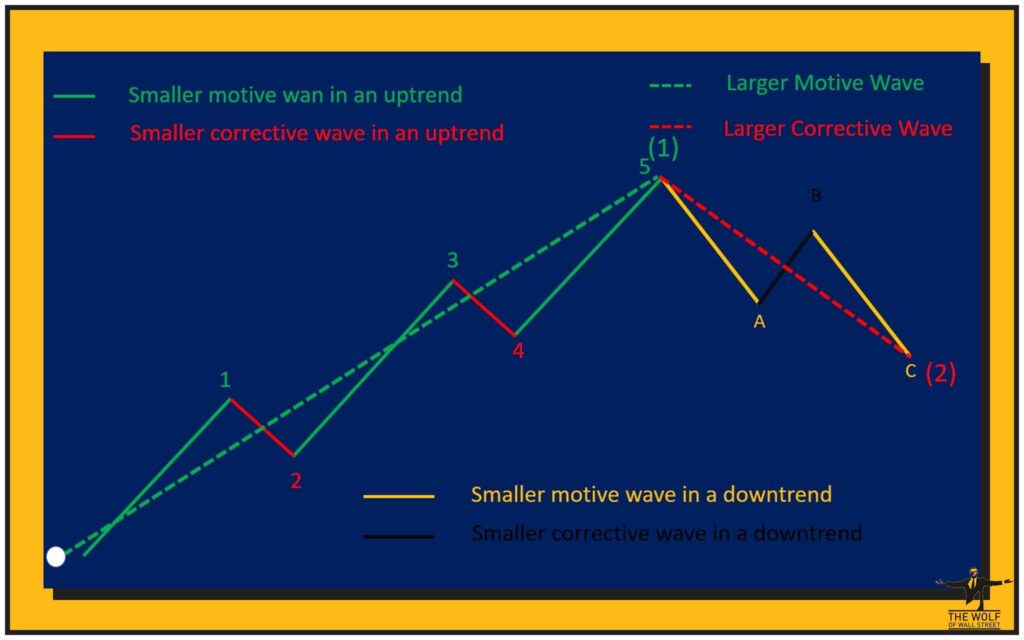
🔄 Waves Within Waves: The Market’s Fractal Nature
One of the most fascinating aspects of Elliott Wave Theory is its fractal nature. This means the patterns repeat themselves on larger and smaller scales simultaneously. A 5-wave impulse on a daily chart is made up of 5 smaller sub-waves on an hourly chart, and each of those sub-waves is made up of even smaller waves on a minute chart, and so on. Similarly, a single corrective wave (like Wave 2 or 4 of a larger impulse) is itself a 3-wave structure internally.
Elliott assigned “degrees” to these waves to keep track of their scale. Examples include:
- Subminuette
- Minuette
- Minor
- Intermediate
- Primary
- Cycle
- Supercycle
- Grand Supercycle
Understanding degrees helps you place the current price action in context within the larger market picture. Are you in a minor Wave 3 of an intermediate Wave 5 of a primary Wave 3? Knowing this gives you perspective on the likely magnitude and duration of moves. It shows how markets are self-similar across all timeframes.
📐 Fibonacci and Elliott Waves: Proportional Relationships
Elliott noticed that the relationships between waves often align with numbers and ratios from the Fibonacci sequence (1, 1, 2, 3, 5, 8, 13, 21, etc., where each number is the sum of the two preceding ones). The ratios derived from this sequence (like 0.618, 1.618, 0.382, 0.5) frequently show up as common retracement and extension levels for waves.
- Fibonacci Retracements: These help predict how far corrective waves might pull back. Wave 2 often retraces 50% or 61.8% of Wave 1. Wave 4 often retraces 38.2% or 50% of Wave 3. Plotting these levels on your chart can give you potential targets for the end of corrections.
- Fibonacci Extensions/Projections: These help forecast potential targets for impulse waves, especially Wave 3 and Wave 5. Wave 3 is frequently a 1.618 or 2.618 extension of Wave 1 measured from the end of Wave 2. Wave 5 can be equal in length to Wave 1, or a 0.618 extension of Wave 1, or related to the length of Waves 1 through 3. Using Fibonacci tools with wave counts provides concrete price targets.
Fibonacci ratios aren’t magic, but their frequent appearance in market patterns makes them invaluable when used alongside Elliott Wave analysis. They provide objective levels to watch.
🧠 Investor Psychology: The Driving Force
Elliott believed that wave patterns are a visual representation of collective investor psychology oscillating between optimism and pessimism. Each wave corresponds to a phase in market sentiment:
- Wave 1: A small group of informed buyers/sellers starts the move against the prevailing sentiment.
- Wave 2: The earlier trend believers cause a pullback based on doubt or profit-taking.
- Wave 3: The majority identifies the new trend, leading to strong conviction and participation (often driven by excitement or fear of missing out).
- Wave 4: Profit-taking or doubt creeps in again, causing a corrective pause.
- Wave 5: The final push, often driven by public participation or speculation, sometimes reaching euphoric or desperate levels before the trend reverses.
Understanding the psychology behind each wave can help you anticipate what kind of price action and volume to expect. It adds a layer of behavioural analysis to the structural counting.
🎯 Elliott Wave in Practice: Trading Strategies
Applying Elliott Wave Theory isn’t about predicting the future with certainty; it’s about putting probabilities in your favour. Traders use wave counts to identify potential trade setups.
- Identifying Entry Points: A common strategy is to look for an entry at the end of a corrective wave (like Wave 2 or Wave 4 in an impulse, or Wave B in a correction), anticipating the next impulse wave. You might look for buy signals at a Fibonacci retracement level that coincides with the end of Wave 2 or 4.
- Setting Profit Targets: Once in a trade based on a wave count, Fibonacci extensions and projections provide potential targets for the end of the next impulse wave. For instance, targeting the 1.618 extension of Wave 1 for the end of Wave 3.
- Defining Invalidation Levels: This is critical for managing risk. Elliott’s rules provide clear points where your wave count is proven wrong. For example, if you’re counting an impulse Wave 3 up, and price falls below the start of what you labeled Wave 1, your count is invalid, and you exit the trade. These rules give you objective stop-loss placement.
Using wave counts requires patience, waiting for patterns to confirm, and discipline to follow the rules and your trade plan.
🚧 The Challenges and Subjectivity: Applying the Theory
Let’s be straight: counting waves in real-time is tough. Markets are noisy, and price action doesn’t always fit textbook patterns perfectly. This leads to the main challenge – subjectivity. Different traders can look at the same chart and come up with different, seemingly valid, wave counts.
- Real-Time Counting Difficulties: It’s much easier to count waves on a completed chart than when price is still developing. The “correct” count only becomes obvious in hindsight.
- Multiple Valid Counts: Sometimes, based on the rules, more than one wave count can fit the price action. This is where it gets tricky and requires experience and using other tools for confirmation.
- Need for Confirmation: Relying solely on Elliott Wave Theory can be misleading. It’s best used as a framework to generate hypotheses about future price action, which you then confirm using other technical indicators or analysis methods.
Despite the subjectivity, adhering strictly to Elliott’s core rules helps filter out incorrect counts. When a rule is broken, that specific count is invalidated, and you look for an alternative.
🤝 Using Elliott Wave with Other Indicators
No single tool tells you everything. Elliott Wave Theory is powerful when used as a primary framework, but it gets even stronger when you combine it with confirming indicators.
For example, if your wave count suggests the end of Wave 5 (expecting a correction), and momentum indicators like RSI are showing extreme overbought levels or bearish divergence, that confluence significantly strengthens the probability of a pending price reversal.
Similarly, if your count suggests a Wave 3 impulse move is starting, and volume is picking up dramatically, and a volatility tool like Bollinger Bands is showing expansion, that adds strong confirmation to your count. Learning about other tools, such as those discussed in articles on RSI Trading Strategies, can provide valuable confirmation signals. Combining different forms of analysis gives you a multi-dimensional view of the market.
Understanding technical tools is key for navigating markets, particularly digital asset markets discussed in articles on Cryptocurrencies. For those just starting out, getting a handle on these concepts is a solid step forward, as outlined in guides for Newbie traders. Mastering chart analysis requires practice and access to solid Trading Insights.
Frequently Asked Questions (FAQs)
- What is the basic structure of an impulse wave?
A standard impulse wave consists of five sub-waves moving in the direction of the larger trend, labeled 1, 2, 3, 4, and 5. - What is the basic structure of a corrective wave?
A standard corrective wave consists of three sub-waves moving against the direction of the larger trend, labeled A, B, and C. - Are Elliott Wave patterns always easy to identify in real-time?
No, identifying and counting waves in real-time can be challenging due to market noise and the subjective nature of interpretation. - How do Fibonacci ratios relate to Elliott Wave Theory?
Fibonacci retracement and extension levels frequently coincide with the termination points of waves, providing potential price targets and support/resistance levels. - What happens if a rule of Elliott Wave structure is broken?
If a rule is broken (e.g., Wave 4 overlaps Wave 1 price territory in an impulse), the specific wave count being used is invalidated, and an alternative count must be considered.
There you have it – the breakdown of Elliott Wave Theory, a powerful way to structure your view of the market and spot potential profit opportunities.

“The Wolf Of Wall Street crypto trading community offers a comprehensive platform for navigating the volatile cryptocurrency market. Here’s what you gain:
- Exclusive VIP Signals: Access proprietary signals designed to maximize trading profits.
- Expert Market Analysis: Benefit from in-depth analysis from seasoned crypto traders.
- Private Community: Join a network of over 100,000 like-minded individuals for shared insights and support.
- Essential Trading Tools: Utilize volume calculators and other resources to make informed decisions.
- 24/7 Support: Receive continuous assistance from our dedicated support team.
Empower your crypto trading journey:
- Visit our website: https://tthewolfofwallstreet.com/ for detailed information.
- Join our active Telegram community: https://t.me/tthewolfofwallstreet for real-time updates and discussions.
- Unlock your potential to profit in the crypto market with “The Wolf Of Wall Street””