
Every serious trader needs an edge. You need to know where the market is likely to pause, where it might turn, and where the big money targets its exits. Forget guesswork. We’re talking about Fibonacci Retracement and Extension, a tool based on a simple sequence of numbers found throughout nature and, yes, in financial markets. These levels aren’t magic, but they show you potential price zones based on predictable market geometry. Master this, and you start trading with levels that professionals watch.

📐 The Math Behind the Market
Where do these levels come from? It starts with the Fibonacci sequence: 1, 1, 2, 3, 5, 8, 13, 21, 34, 55, and so on. Each number after the first two is simply the sum of the two preceding numbers (1+1=2, 1+2=3, 2+3=5, etc.).
The power comes from the ratios you get when you divide numbers in the sequence:
- Divide a number by the number that follows it (e.g., 55 / 89): You get a ratio close to 0.618. This is the famous Golden Ratio, Phi.
- Divide a number by the number two places after it (e.g., 34 / 89): You get a ratio close to 0.382.
- Divide a number by the number three places after it (e.g., 21 / 89): You get a ratio close to 0.236.
Other ratios are derived from these, like 0.786 (the square root of 0.618), and inverses like 1.618 (the Golden Ratio itself), 2.618, and 4.236.
Why do these matter in markets? No one agrees 100%, but many believe they reflect underlying patterns in human behaviour and collective psychology, which drives market prices. These ratios appear in natural growth patterns, art, architecture, and surprisingly often, as points where market trends pause or reverse.
🤔 Fibonacci Retracement: Spotting Pullback Zones
A retracement is a temporary price pullback within a larger trend. If a stock is trending up, a retracement is a dip. If it’s trending down, a retracement is a bounce. Fibonacci Retracement helps you identify potential support or resistance levels where these pullbacks might end and the main trend could resume.
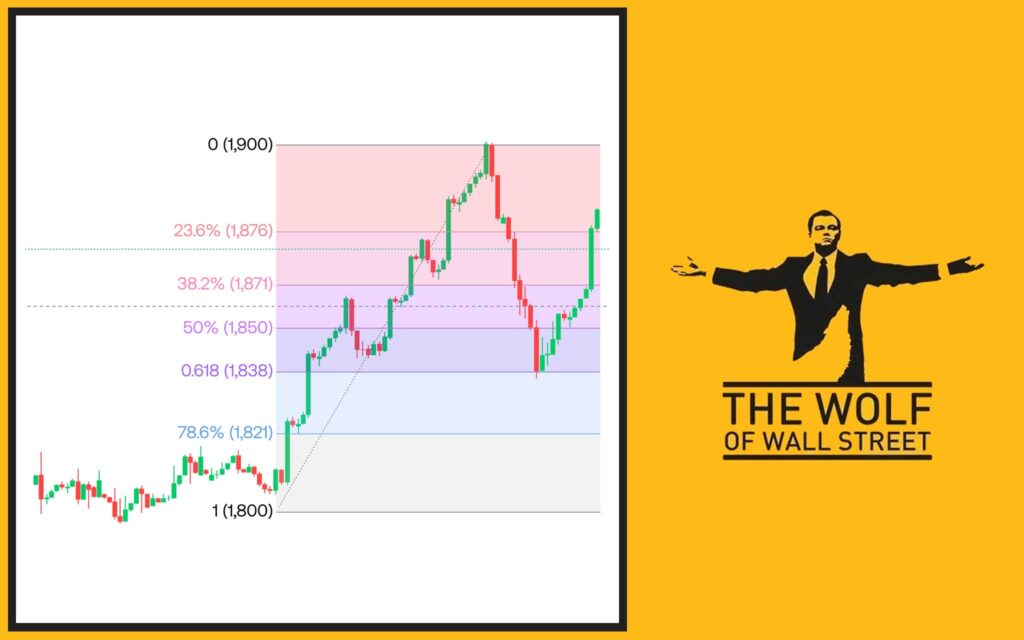
You calculate these levels by taking a major price move (a swing high to a swing low in a downtrend, or a swing low to a swing high in an uptrend) and then plotting horizontal lines at the key Fibonacci percentage levels of that move.
The Key Retracement Levels: These are the percentages to tattoo on your brain:
- 23.6%: The shallowest retracement level. Sometimes acts as minor support/resistance.
- 38.2%: A more significant level. Often seen as a reasonable pullback depth.
- 50%: While not strictly a Fibonacci ratio, the 50% retracement is a widely watched level reflecting a balanced correction. Markets frequently correct about half of the previous move.
- 61.8%: The Golden Ratio retracement. This is arguably the most significant level traders watch for potential reversals. A deep pullback to the 61.8% level is common.
- 78.6%: Another deep retracement level. Sometimes used, though less frequently than 61.8%.
To draw them correctly, you identify a clear swing low and the subsequent swing high in an uptrend, or a clear swing high and the subsequent swing low in a downtrend. Use your charting tool to draw the Fibonacci retracement lines between these two points. The tool will automatically show the horizontal lines at the percentage levels based on that price range. The levels extend horizontally into the future.
These levels aren’t guaranteed turning points, but they mark zones where the probability of a reaction is statistically higher based on historical market behaviour aligned with these natural ratios.
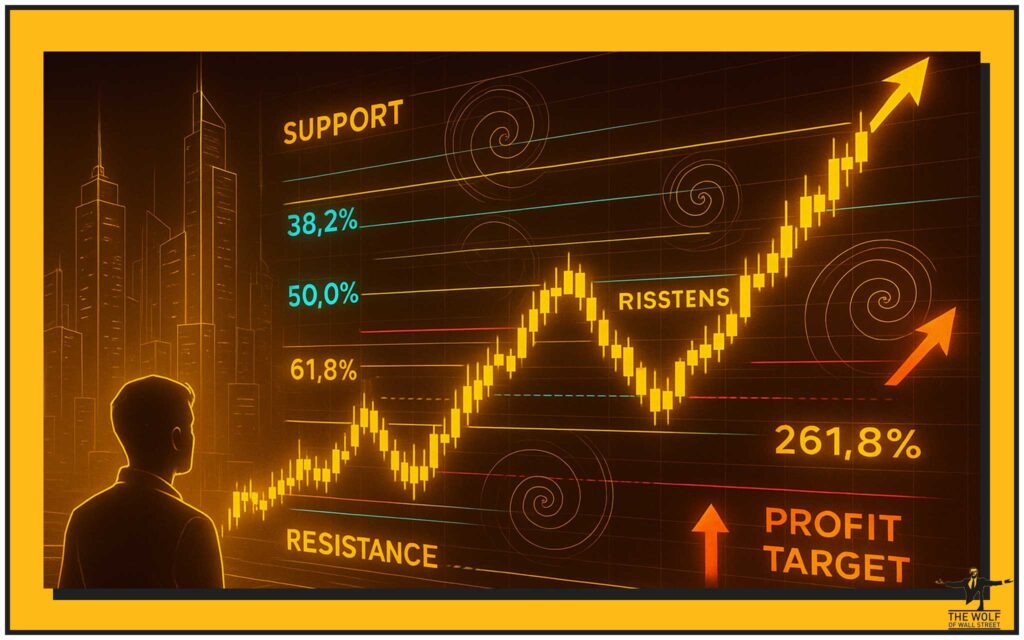
📈 Fibonacci Extension: Projecting Profit Targets
While retracements help find potential entry points during pullbacks, Fibonacci Extension helps you forecast potential profit targets after a pullback finishes and the main trend resumes. Extensions project price levels beyond the end of the initial move.
You calculate these levels using a three-point tool. First, you click the start of the initial move (swing low in uptrend, swing high in downtrend). Second, click the end of that initial move (swing high in uptrend, swing low in downtrend). Third, click the end of the retracement (the low of the pullback in an uptrend, the high of the bounce in a downtrend). The tool will then project price levels based on Fibonacci ratios of the initial move, measured from the end of the retracement.
The Key Extension Levels: These are your potential exit points:
- 127.2% (Derived from the square root of 1.618)
- 161.8% (The Golden Ratio extension)
- 261.8%
- 423.6%
These levels represent potential price resistance in an uptrend or support in a downtrend, where the impulse move might complete or pause. Using extension levels provides objective targets for taking profits once a trade moves in your favour. They give you a plan for your exit before you even enter the trade.
✅ Fibonacci in Action: Trading Strategies
Putting Fibonacci Retracement and Extension into practice is about using these levels to build high-probability trade setups.
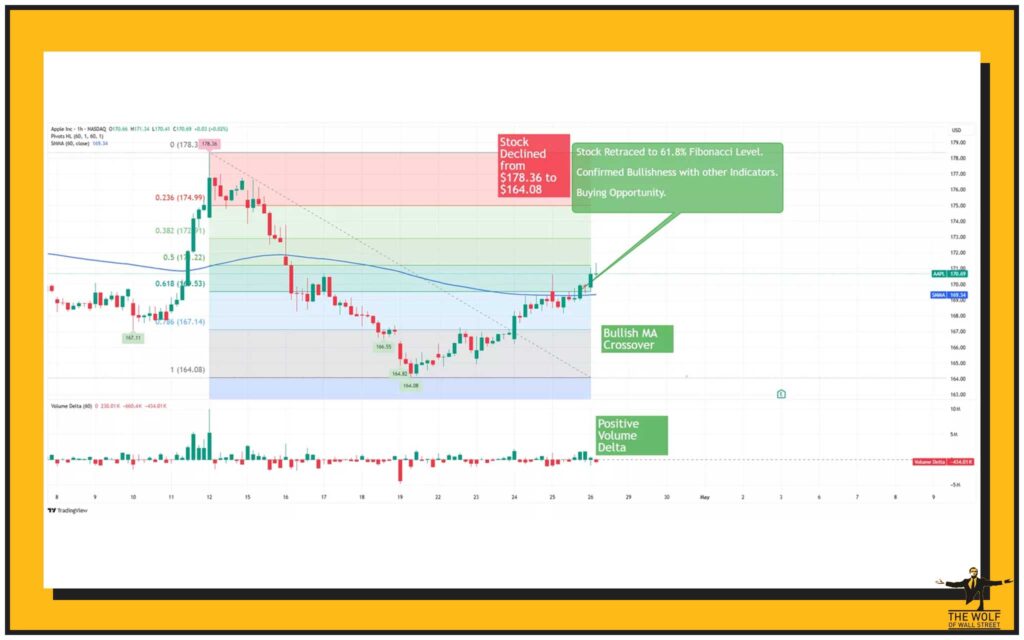
Entry Strategies: The classic approach is to look for opportunities when price pulls back to a key retracement level (like 38.2%, 50%, or 61.8%).
- In an uptrend, wait for price to dip to a Fibonacci support level. Look for signs of the pullback ending (e.g., a bullish candlestick pattern) and enter a buy order.
- In a downtrend, wait for price to bounce to a Fibonacci resistance level. Look for signs the bounce is ending (e.g., a bearish candlestick pattern) and enter a sell (short) order.
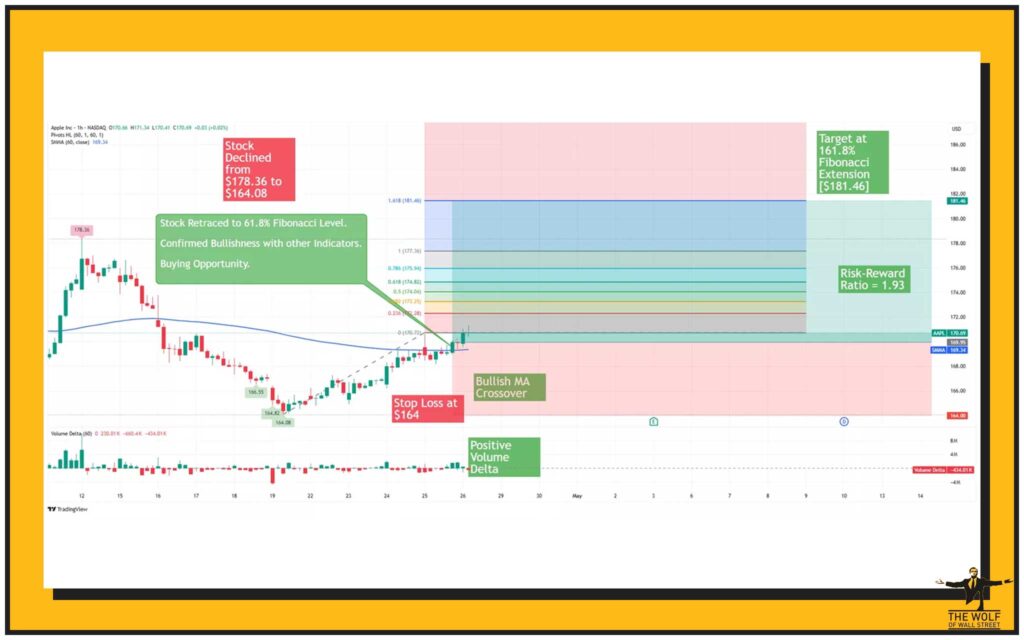
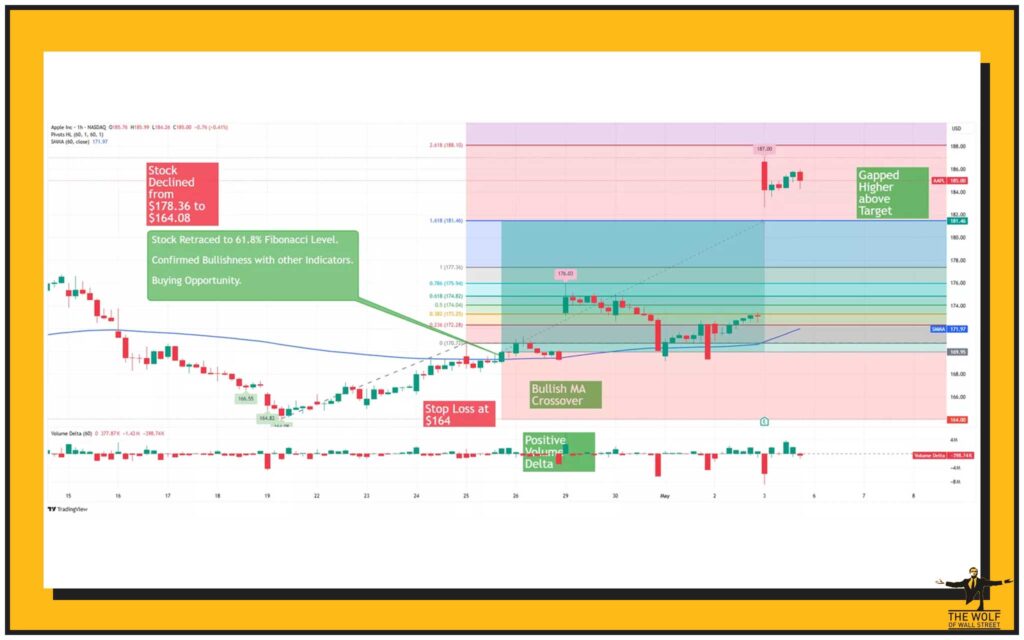
Setting Profit Targets: Once you’re in a trade and the price moves in the direction of the main trend, use Fibonacci extension levels to plan your exit. If you entered on a pullback (Wave 2 in an Elliott Wave count, for instance), your targets might be the 161.8% or 261.8% extensions of the initial move. Using these predefined levels takes the guesswork out of where to take profits.
Placing Stop Losses: Fibonacci levels are also invaluable for managing risk. If you enter a long trade at the 61.8% retracement level, your stop loss should be placed just below the next significant Fibonacci level down (e.g., the 78.6% level) or below the swing low used to draw the initial Fibonacci levels. If price moves past your stop, your analysis based on that Fibonacci setup is likely wrong, and you exit with a controlled loss. This ensures you protect your capital.
The ‘Bounce Play‘ is a direct strategy: identify a strong trend, draw your Fibonacci levels on the most recent impulse move, and wait for price to pull back sharply to a key level (especially 50% or 61.8%). If price shows a clear reversal signal at that level, jump in, anticipating a bounce back in the direction of the main trend.
🤝 Using Fibonacci with Other Tools: Building Confluence
Fibonacci levels are powerful signals, but they are rarely used alone. Their effectiveness goes up exponentially when they align with signals from other technical analysis tools. This is called building confluence. When multiple indicators point to the same price level or potential turning point, the probability of that event happening increases significantly.
- Combining Fibonacci with Trend Lines and Chart Patterns: If a key Fibonacci retracement level also happens to be where a major trend line provides support or resistance, or where a chart pattern completes, that level becomes much more significant.
- Fibonacci and Moving Averages: When a commonly watched moving average (like the 50-period or 200-period MA) intersects or aligns with a Fibonacci retracement level, it strengthens the potential support or resistance at that price.
- Fibonacci and Momentum Indicators: Tools like RSI Trading Strategies, Stochastic, or Money Flow Index Strategies can help confirm Fibonacci signals. If price hits a 61.8% retracement and RSI shows oversold conditions and starts to turn up, that’s a strong buy signal. Or if price reaches a 161.8% extension target and RSI shows overbought divergence, it suggests the impulse move might be ending. Understanding how to use momentum alongside Fibonacci is a key part of effective trading.
- Fibonacci and Volatility Indicators: Combining Fibonacci with tools that measure market volatility, like Bollinger Bands, can provide added context. If price is reacting at a Fibonacci level and the Bollinger Bands are simultaneously showing a ‘squeeze’ or a touch of an outer band at that level, it provides additional information about the market’s state.
- Fibonacci and Wave Theory: As discussed in the article on Elliott Wave Theory, Fibonacci ratios are intrinsically linked to wave patterns. Wave 2 and 4 frequently retrace specific Fibonacci percentages of the preceding impulse wave, and Wave 3 and 5 often extend to specific Fibonacci multiples. Using Fibonacci with Elliott Wave helps validate wave counts and set precise targets.
Building confluence is non-negotiable. Don’t trade just because price hit a Fibonacci level. Trade because price hit a Fibonacci level AND you have confirmation from other tools.
Understanding how different technical tools work together is part of building a solid foundation in trading, especially in complex markets like Cryptocurrencies. For those new to trading, exploring resources that provide solid Trading Insights is a smart move. Beginners should focus on grasping the basics first, as outlined in guides for Newbie traders.
🚧 The Subjectivity and Limitations
Fibonacci tools are powerful, but they aren’t without their challenges. The biggest one? Subjectivity.
Choosing Swing Points: The accuracy of your Fibonacci levels depends entirely on the swing high and swing low points you select to draw the tool. Different traders will pick different points, leading to different sets of Fibonacci levels on the same chart. This subjectivity can make it hard to agree on the ‘correct’ levels to watch.
Fibonacci levels are levels of interest, not hard guarantees. Price doesn’t have to stop or reverse exactly at the 61.8% line. It might overshoot, fall short, or punch right through. They are zones to watch for potential reactions.
False Signals: Relying solely on Fibonacci levels can lead to false signals and losing trades. Without confirmation from other indicators or analysis, you might enter a trade based on a level that price simply ignores.
Over-Reliance Risk: Because Fibonacci levels are so widely watched, some argue they become self-fulfilling prophecies – traders react to them because they expect others to react. While there might be truth to this, the underlying mathematical basis suggests their significance goes beyond mere popularity. However, relying only on Fibonacci is a risky game.
Fibonacci tools also do not predict time or give information about volume or market volatility on their own. They provide price levels. You need other tools for those dimensions of analysis.
⚙️ Adapting Fibonacci for Different Markets
The beauty of Fibonacci ratios is that they are mathematical constants. They apply across different markets – stocks, forex, commodities, and yes, digital assets like Bitcoin and Altcoins.
However, the behaviour of price around these levels can vary depending on the market’s characteristics. Highly volatile markets like many cryptocurrencies might see deeper retracements or faster moves through levels compared to less volatile markets. While the levels themselves are constant, understanding the typical price action and volatility of the specific asset you are trading is important when applying Fibonacci strategies.
🛡️ Risk Management with Fibonacci
Fibonacci levels are a fantastic tool for structuring your risk.
Using the levels to define your invalidation point (where your analysis is wrong) is key for stop placement. If your long trade relies on support at the 61.8% retracement, placing your stop just below the 78.6% level or the swing low provides a logical exit point if the support fails.
Knowing the distance between your planned entry and your stop loss (derived from Fibonacci levels) is essential for position sizing. You can calculate how many shares or contracts (or crypto units) to trade to keep your potential loss within acceptable limits if your stop is hit. Fibonacci helps you quantify the risk of a specific setup.
📊 Real-World Application: Example Breakdown
Let’s consider a hypothetical scenario in the crypto market. Imagine Bitcoin has a strong rally from $60,000 (Swing Low) to $70,000 (Swing High). You draw your Fibonacci Retracement tool from $60,000 to $70,000. Key levels appear at $67,084 (23.6%), $66,180 (38.2%), $65,000 (50%), $63,820 (61.8%), and $62,140 (78.6%).
Bitcoin price then starts to pull back from $70,000. It dips towards the 61.8% retracement level around $63,820. As price reaches this zone, you notice a bullish engulfing candlestick pattern forming on your chart, and the RSI on a lower timeframe is coming out of oversold territory.
This confluence of signals (price hitting a key Fibonacci level + bullish candle pattern + momentum turning up) presents a potential buying opportunity. You decide to enter a long trade near $64,000.
You draw your Fibonacci Extension tool using the $60,000 low, the $70,000 high, and the $64,000 pullback low. Potential profit targets appear at $71,618 (161.8% extension), $76,180 (261.8% extension), and so on. You decide your primary target is the 161.8% extension at $71,618.
For risk management, you place your stop loss just below the 78.6% retracement level, say at $61,500. This defines your maximum risk on the trade. If Bitcoin falls below $61,500, your initial read of the pullback ending at the 61.8% level was likely wrong, and you exit. If price reaches $71,618, you take profits. This example shows how retracements help entries, extensions help exits, and both help structure risk with objective levels.
Frequently Asked Questions (FAQs)
- What is the difference between Fibonacci Retracement and Extension?
Retracements help identify potential support or resistance levels during price pullbacks, while extensions help forecast potential profit targets beyond the initial price swing. - Are the 50% and 78.6% levels true Fibonacci ratios?
The 50% level is not strictly a Fibonacci ratio but is widely used. The 78.6% level is the square root of the Golden Ratio (0.618) and is a recognised Fibonacci-derived level. - Can Fibonacci levels predict exactly where the price will turn?
No, Fibonacci levels provide probable zones of support or resistance, not exact turning points. They work best when confirmed by other indicators or price action signals. - What is the Golden Ratio in Fibonacci trading?
The Golden Ratio is approximately 1.618 (or 0.618 as its inverse). The 61.8% retracement and 161.8% extension levels, derived from this ratio, are considered particularly significant. - Why is choosing the correct swing high and swing low important?
The accuracy of the plotted Fibonacci levels depends entirely on selecting relevant and significant swing high and swing low points from the price chart. Incorrect points will generate irrelevant levels.
There you have it – the essential guide to using Fibonacci Retracement and Extension. These levels give you an objective way to analyse pullbacks, set targets, and control risk, putting you ahead of those just guessing.
“The Wolf Of Wall Street crypto trading community offers a comprehensive platform for navigating the volatile cryptocurrency market. Here’s what you gain:
- Exclusive VIP Signals: Access proprietary signals designed to maximize trading profits.
- Expert Market Analysis: Benefit from in-depth analysis from seasoned crypto traders.
- Private Community: Join a network of over 100,000 like-minded individuals for shared insights and support.
- Essential Trading Tools: Utilize volume calculators and other resources to make informed decisions.
- 24/7 Support: Receive continuous assistance from our dedicated support team.
Empower your crypto trading journey:
- Visit our website: https://tthewolfofwallstreet.com/ for detailed information.
- Join our active Telegram community: https://t.me/tthewolfofwallstreet for real-time updates and discussions.
- Unlock your potential to profit in the crypto market with “The Wolf Of Wall Street””