
Want to know when a trend is starting, slowing down, or potentially reversing? Forget static charts. You need an indicator that tells you about momentum, the speed and strength of price moves. That’s MACD, the Moving Average Convergence/Divergence. This tool cuts through the noise and signals shifts you need to see to make decisive trades. Get this right, and you put yourself ahead of the crowd.

💪 What is MACD? The Power of Moving Averages
So, what exactly is this MACD? It stands for Moving Average Convergence/Divergence, and it was created by a sharp analyst named Gerald Appel in the late 1970s. His goal was to build a tool that combined elements of both trend following and momentum.
MACD does this by looking at the relationship between two different moving averages of an asset’s price – typically Exponential Moving Averages (EMAs) because they give more weight to recent price data. The ‘Convergence/Divergence’ part refers to whether these two moving averages are moving closer together (converging) or farther apart (diverging). This movement reveals shifts in momentum. When faster moving averages pull away from slower ones, it indicates increasing momentum in that direction.
MACD is primarily used as a trend-following momentum indicator. This means it helps confirm the direction of a trend and measures the strength of that trend. It’s a powerful tool for spotting potential trend beginnings, continuations, and, importantly, potential reversals before they show up clearly on the price chart itself.
🤔 Anatomy of the MACD Indicator
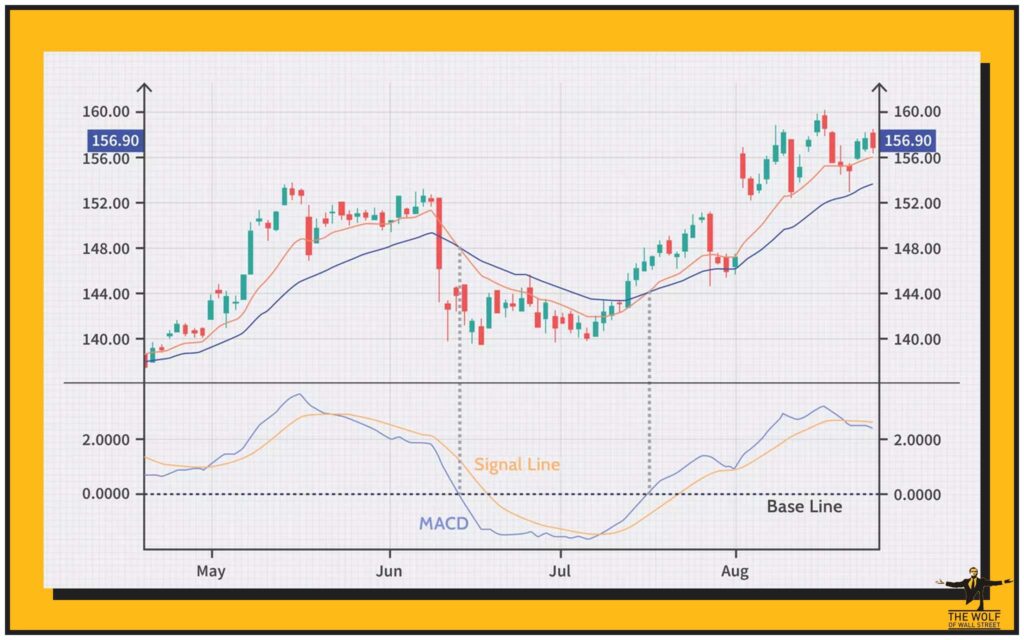
When you add the MACD indicator to your charting platform, you typically see three things plotted below the price chart: two lines and a histogram.
The MACD Line: How it’s calculated (Difference of two EMAs).
This is the core line of the indicator. It’s calculated by subtracting the value of a longer-period Exponential Moving Average (EMA) from the value of a shorter-period EMA. The standard setting uses the 12-period EMA and the 26-period EMA.
MACD Line = (12-period EMA) – (26-period EMA)
The MACD line moves above and below a central zero line. When the 12-period EMA is above the 26-period EMA, the MACD line is positive (above zero), suggesting bullish momentum. When the 12-period EMA is below the 26-period EMA, the MACD line is negative (below zero), suggesting bearish momentum.
The Signal Line: How it’s derived (9-period EMA of the MACD Line).
The Signal Line is an Exponential Moving Average of the MACD Line itself. The standard setting for the signal line is typically a 9-period EMA.
Signal Line = (9-period EMA of MACD Line)
Because it’s an average of the MACD Line, the Signal Line smooths out the MACD Line’s movements and tends to lag slightly behind it. This lagging relationship is crucial for generating trading signals.
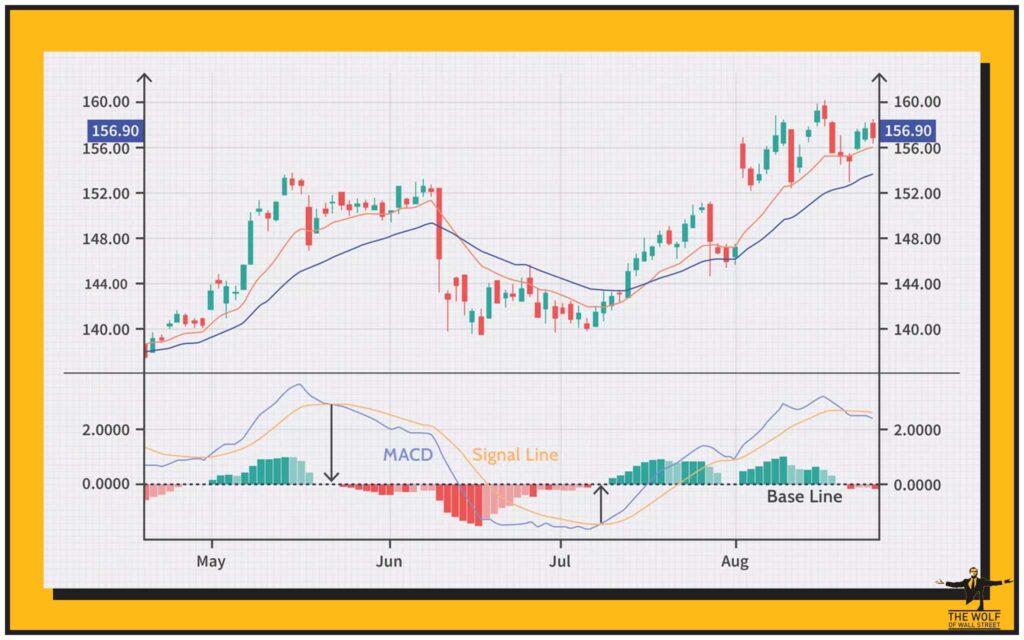
The Histogram: Visualising the relationship between the MACD and Signal lines.
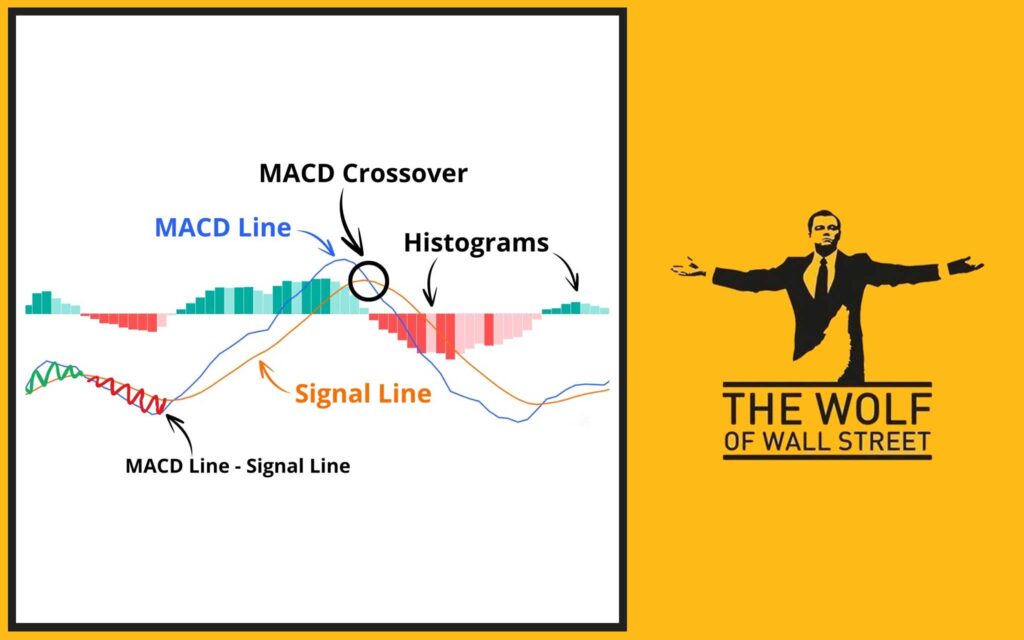
The Histogram is a bar graph plotted around the zero line. Each bar represents the difference between the MACD Line and the Signal Line for that specific time period.
Histogram = MACD Line – Signal Line
When the MACD Line is above the Signal Line, the histogram bars are positive (above the zero line). When the MACD Line is below the Signal Line, the histogram bars are negative (below the zero line). The height of the histogram bars reflects the distance between the two lines, indicating the strength of the momentum signal. Rising histogram bars (getting taller above zero or less negative below zero) show increasing momentum. Falling bars show decreasing momentum.
Standard Settings (12, 26, 9) and Customization: Adjusting parameters for different markets or styles.
The default settings (12-period EMA for the fast line, 26-period EMA for the slow line, and 9-period EMA for the signal line) are the most common and work well for many markets and timeframes. However, traders can adjust these settings. Using shorter periods will make the MACD more sensitive to price changes, potentially generating more signals (but also more false ones). Longer periods will make it smoother and less sensitive, generating fewer signals (potentially more reliable, but later). Experimentation and backtesting are needed to find optimal settings for specific assets or trading styles.
👀 Reading the Signals: What MACD Tells You
Understanding how the MACD Line, Signal Line, and Histogram interact gives you a powerful view into market momentum and potential price moves.
MACD Line and Signal Line Crossovers: The classic trading signal.
This is the most widely used MACD signal. Because the Signal Line is an EMA of the MACD Line, the MACD Line tends to turn before the Signal Line. A crossover suggests a shift in momentum strong enough for the faster line to cross the slower one.
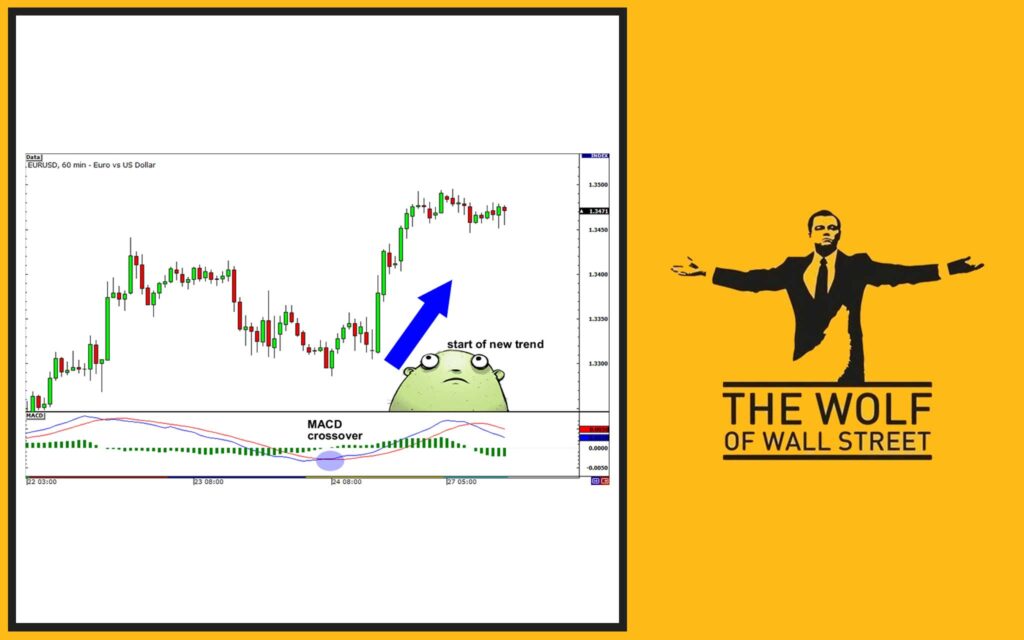
- Bullish Crossovers: When the MACD Line crosses above the Signal Line. This indicates that the short-term momentum is accelerating faster than the medium-term momentum, suggesting potential upside price movement. It’s often considered a buy signal.
(Imagine a price chart showing a downtrend or sideways consolidation. Below it, the MACD indicator is plotted. The blue MACD line dips below the red Signal line (bearish crossover), then starts to curve upwards. When the blue line crosses back above the red Signal line, that’s a bullish crossover. On the price chart, this might coincide with price starting to tick up or break above short-term resistance.) - Bearish Crossovers: When the MACD Line crosses below the Signal Line. This indicates that the short-term momentum is slowing down or accelerating downwards faster than the medium-term momentum, suggesting potential downside price movement. It’s often considered a sell signal.
(Picture a price chart showing an uptrend or sideways consolidation. Below it, the MACD indicator is plotted. The blue MACD line rises above the red Signal line (bullish crossover), then starts to curve downwards. When the blue line crosses back below the red Signal line, that’s a bearish crossover. On the price chart, this might coincide with price starting to tick down or break below short-term support.)
Crossovers are more significant when they occur far above or below the zero line, indicating strong momentum in that direction. Crossovers near the zero line can be less reliable, especially in choppy markets.
MACD Divergences: Spotting potential trend reversals before they happen.
Divergence occurs when the price action makes a new high or low, but the MACD indicator fails to make a corresponding new high or low. This mismatch suggests that the momentum supporting the current price trend is weakening, potentially signalling a coming reversal.
- Bullish Divergence: Price makes a lower low, but the MACD makes a higher low. This means the price is dropping, but the downward momentum is actually weakening. It suggests potential for an upside reversal.
(Visualise a price chart making two distinct swing lows, where the second low is lower than the first. Look at the MACD indicator below. If the MACD line makes two corresponding lows, but the second MACD low is higher than the first MACD low, that’s bullish divergence. This pattern suggests the downtrend might be losing steam before price actually turns up.) - Bearish Divergence: Price makes a higher high, but the MACD makes a lower high. This means the price is rising, but the upward momentum is actually weakening. It suggests potential for a downside reversal.
(Picture a price chart making two distinct swing highs, where the second high is higher than the first. Look at the MACD indicator below. If the MACD line makes two corresponding highs, but the second MACD high is lower than the first MACD high, that’s bearish divergence. This pattern suggests the uptrend might be losing steam before price actually turns down.)
Divergences are powerful signals, but they can sometimes fire prematurely, especially against a very strong long-term trend. They are better used as a warning sign to look for other confirmation.
Rapid Rises/Falls: Extreme momentum moves indicating potential overextended conditions.
When the MACD Line rises or falls very sharply and moves far away from the zero line, it indicates that momentum is very strong in that direction. While this confirms the trend, it can also signal that the price move is becoming overextended and might be due for a pullback or consolidation soon. Extreme MACD values suggest extreme momentum.
Zero Line Crossovers: Trend direction shifts.
When the MACD Line crosses above the zero line, it means the 12-period EMA has crossed above the 26-period EMA. This confirms that the short-term momentum has shifted decisively to the upside relative to the medium-term momentum, often indicating a bullish trend is establishing or strengthening. When the MACD Line crosses below the zero line, it confirms a shift to bearish momentum and a potential downtrend. Zero line crossovers are seen as confirmation of the broader trend direction.
🎯 Putting MACD to Work: Trading Strategies
Knowing the signals is one thing; using them to make money is another. Here’s how traders apply MACD.
Trading Crossovers for Entries: Buying on bullish crossovers, selling on bearish ones.
A common strategy is to enter a long position when a bullish crossover occurs, especially if it happens above the zero line or from below the zero line and heading upwards. You’d enter a short position on a bearish crossover, especially if it occurs below the zero line or from above and heading downwards. Stops are typically placed below recent lows for long trades or above recent highs for short trades.
Using Divergences for Potential Reversal Entries: Looking for confirmation after spotting bullish or bearish divergence.
When you spot bullish divergence, you look for confirmation from price action (like a bullish candlestick pattern) or other indicators near a support level. You might enter a long position based on the confirmed reversal signal. With bearish divergence, you look for bearish confirmation near resistance before entering a short position. Divergences get you looking for a turn; confirmation tells you when it might be happening.
Using MACD for Exit Signals: Closing trades when a bearish crossover occurs in an uptrend or a bullish one in a downtrend.
MACD can also help you exit trades. If you’re in a long position and see a bearish crossover on the MACD, it could signal that the upward momentum is fading, and it’s a good time to take profits or exit the trade to avoid a potential downturn. In a short position, a bullish crossover could be your signal to cover.
Trading Zero Line Crossovers: Using the zero line as confirmation of a trend change or continuation.
Some traders use zero line crossovers for confirmation of a trend shift. A bullish crossover above the zero line confirms buying pressure is strong. A bearish crossover below confirms selling pressure. You might enter a trade based on an initial crossover and then add to your position if the MACD also crosses the zero line in the direction of your trade.
📊 MACD Histogram: A Visual Guide to Momentum Shifts
The histogram is more than just decoration; it provides valuable insight into the strength of momentum and can sometimes signal turns before the MACD Line crosses the Signal Line.
Histogram Peaks and Troughs: Signalling momentum strength peaking or bottoming.
The histogram bars grow taller as the MACD Line moves further away from the Signal Line, indicating increasing momentum. When the bars start getting shorter, it means momentum is slowing down, even if the MACD Line hasn’t crossed the Signal Line yet. Rising bars above zero show accelerating bullish momentum; falling bars above zero show bullish momentum slowing. Falling bars below zero show accelerating bearish momentum; rising bars below zero show bearish momentum slowing. (Picture a chart showing the histogram bars. As price moves strongly up, the positive histogram bars get taller. When price’s upward push starts to tire, even before a pullback, the positive histogram bars might start shrinking.)
Histogram Zero Line Crosses: Preceding or confirming MACD line crossovers.
The histogram crosses the zero line exactly when the MACD Line crosses the Signal Line. So, the histogram crossing zero is a direct visual representation of the crossover signal. Looking at the histogram can sometimes give you a slightly earlier visual cue of a potential crossover developing than just watching the lines themselves. (See a chart where the histogram bars move from negative to positive. The moment the bars cross above the zero line corresponds exactly to the MACD line crossing above the Signal line.)
Histogram Divergences with Price: Divergence can sometimes appear on the histogram even if less clear on the MACD line.
Similar to MACD line divergence, the histogram can also show divergence with price, sometimes even more clearly. For example, price makes a higher high, but the histogram peaks are getting lower. This histogram divergence also suggests weakening momentum and potential for a reversal.
⚖️ MACD vs. RSI: Understanding the Difference
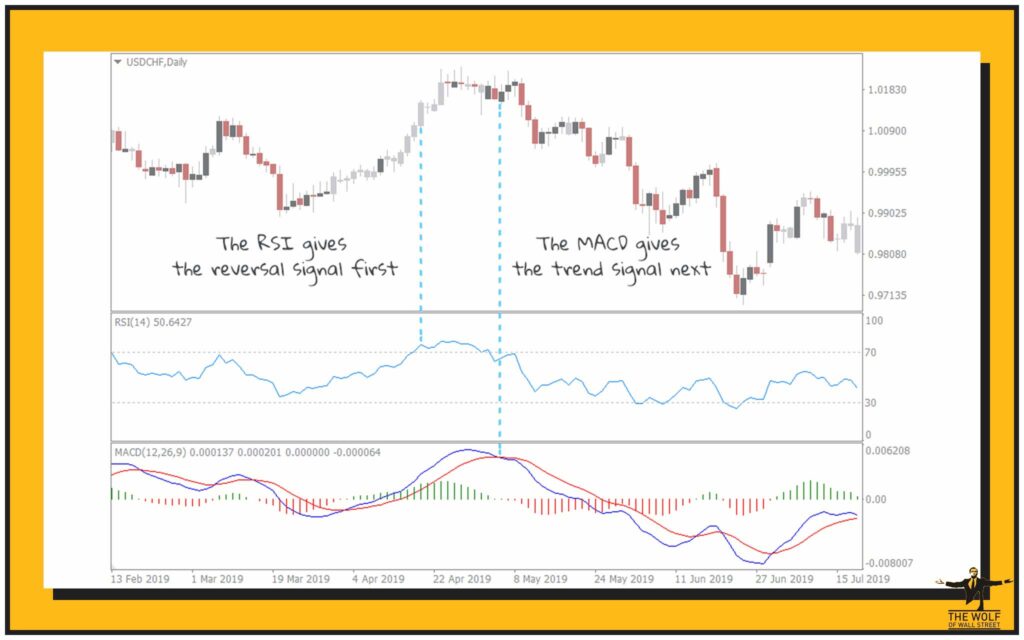
MACD and RSI Trading Strategies are both momentum indicators, but they measure momentum differently and give different types of signals. Understanding this distinction helps you use them effectively, sometimes together.
- How RSI measures the speed of price change (overbought/oversold levels). RSI (Relative Strength Index) is an oscillator that measures the speed and change of price movements. It oscillates between 0 and 100 and is primarily used to identify overbought (typically above 70) and oversold (typically below 30) conditions. It tells you when a price move might be extended and due for a correction.
- How MACD measures the relationship between moving averages (trend following momentum). MACD focuses on the difference between two moving averages, highlighting trend momentum and its changes. It doesn’t have fixed overbought or oversold levels like RSI; what’s considered high or low for MACD depends on the specific asset and timeframe.
MACD is generally better suited for identifying trend direction and momentum in trending markets, while RSI is often better for spotting potential reversal points in ranging or choppy markets due to its overbought/oversold signals. However, many traders use both together for confirmation. A bullish MACD crossover combined with RSI moving up from oversold territory is a powerful confluence signal.
🚧 Limitations and False Signals
No indicator is perfect, and MACD has limitations you must be aware of.
Lagging Nature of MACD: Signals are based on past data, can be late.
Because MACD is calculated using moving averages (which are based on past prices), it is considered a lagging indicator. This means MACD signals often occur after the price move has already begun. This can lead to missing the very start of a move or getting signals that are slightly delayed.
Whipsaws and False Crossovers: MACD can generate false signals in choppy or sideways markets.
In markets that aren’t trending clearly, where price is just moving sideways or oscillating back and forth, the moving averages used in MACD can converge, cross, and diverge repeatedly without any significant price move following. This generates frequent false crossovers or ‘whipsaws’ that can lead to losing trades if not confirmed by other tools or price action. (Consider a chart where price is bouncing back and forth within a tight range. Below, the MACD lines might cross above and below the Signal line multiple times in a short period, with the histogram bars flipping from positive to negative and back, but price goes nowhere. These are false signals.)
Subjectivity in Divergence Interpretation: Identifying valid divergences can sometimes be tricky.
While divergences are powerful, identifying truly significant ones can be subjective. Not all divergences lead to reversals, and sometimes what looks like divergence is just a temporary pause before the trend continues. You need practice and other tools to filter valid divergence signals.
Over-Reliance: Why MACD shouldn’t be used in isolation.
Like any single indicator, relying only on MACD for trading decisions is risky. Its signals are probabilities, not certainties. You need confirmation.
🤝 Confirming MACD Signals with Other Tools
The way to overcome MACD’s limitations and increase signal reliability is by using it with other technical analysis methods. Building confluence is non-negotiable for successful trading.
MACD and Price Action/Candlestick Patterns: Confirming MACD signals with bullish or bearish candlestick patterns.
If you get a bullish MACD crossover, look at the price chart. Is there a bullish engulfing pattern, a hammer, or another bullish reversal candle forming near a support level? Price action confirmation adds significant weight to the MACD signal.
MACD and Trendlines: Using MACD crossovers or zero line crosses to confirm trendline breaks or bounces.
If price is bouncing off an uptrend line (potential support) and you simultaneously see a bullish MACD crossover or the MACD line crossing above the zero line, that confluence strengthens the case for a bounce and trend continuation. A break below a downtrend line is more credible if accompanied by a bearish MACD crossover and the MACD line crossing below zero (linking to Trendlines Article).
MACD and Support/Resistance Levels: Looking for MACD signals at key price levels.
MACD signals that occur at or near established support or resistance zones on the price chart tend to be more reliable. A bullish crossover at a major support level, or bearish divergence near a strong resistance level, increases the probability of a price reaction at that point.
MACD and Other Indicators: Confirming signals with indicators like ADX (for trend strength), Bollinger Bands, Stochastic, or MFI.
Combining MACD with other momentum oscillators like Stochastic Indicator Strategies or Money Flow Index Strategies provides alternative views of momentum. Using ADX can confirm if a trend is actually in place (MACD is best in trending markets). Bollinger Bands can show volatility context around MACD signals. Combining signals from multiple tools provides a layered approach to market analysis and helps filter false signals.
Understanding how these different technical tools work together is part of building a solid foundation in trading, especially in dynamic digital asset markets discussed in resources on Cryptocurrencies. For anyone starting out, exploring resources that provide solid Trading Insights is a smart move. Beginners should focus on grasping the basics first, as explained in guides for Newbie traders. Tools like Elliott Wave Theory and Fibonacci Retracement and Extension offer deeper pattern analysis that can complement indicator signals.
Frequently Asked Questions (FAQs)
- What are the three main components of the MACD indicator?
The three main components are the MACD Line, the Signal Line, and the Histogram. - What is the most common trading signal generated by MACD?
The most common signal is the crossover between the MACD Line and the Signal Line (bullish when MACD crosses above Signal, bearish when it crosses below). - What is MACD divergence and what does it suggest?
Divergence occurs when price makes a new high/low, but MACD makes a lower high/higher low. It suggests that the momentum supporting the current trend is weakening, potentially signaling a trend reversal. - Is MACD a leading or lagging indicator?
MACD is considered a lagging indicator because its calculations are based on past price data (moving averages). - Why is it recommended to use MACD with other indicators?
Combining MACD signals with other technical analysis tools (like price action, trendlines, or other indicators) helps confirm the MACD signals, reduce false positives, and increase the reliability of trade setups.
There you have it – MACD, your guide to seeing market momentum and finding those higher probability trading opportunities.

“The Wolf Of Wall Street crypto trading community offers a comprehensive platform for navigating the volatile cryptocurrency market. Here’s what you gain:
- Exclusive VIP Signals: Access proprietary signals designed to maximize trading profits.
- Expert Market Analysis: Benefit from in-depth analysis from seasoned crypto traders.
- Private Community: Join a network of over 100,000 like-minded individuals for shared insights and support.
- Essential Trading Tools: Utilize volume calculators and other resources to make informed decisions.
- 24/7 Support: Receive continuous assistance from our dedicated support team.
Empower your crypto trading journey:
- Visit our website: https://tthewolfofwallstreet.com/ for detailed information.
- Join our active Telegram community: https://t.me/tthewolfofwallstreet for real-time updates and discussions.
- Unlock your potential to profit in the crypto market with “The Wolf Of Wall Street””