
📊 Introduction to the Money Flow Index (MFI)
Alright, listen up—if you want to dominate the market like a true alpha, you need more than just the basics. You need tools that give you the edge. That’s where the Money Flow Index (MFI) comes in, and let me tell you, this thing is a game-changer. The MFI is a volume-weighted indicator that combines price action with volume to give you a deeper look at market sentiment. Forget about simple price charts that only tell half the story. MFI gives you the full picture and helps you make the right moves before everyone else catches on.
Here’s the thing: MFI isn’t just a nice-to-have. It’s essential for navigating the volatile markets of 2025. And trust me, The Wolf of Wall Street didn’t rise to the top by relying on outdated methods. Whether you’re trading crypto, stocks, or forex, MFI is the weapon you need in your arsenal. If you’re serious about trading, you can’t afford to ignore this.
So buckle up, because I’m about to show you how to wield the MFI like a pro and use it to boost your profits. The market’s moving fast, and if you don’t get in the game, you’re going to get left behind.
📈 How the Money Flow Index (MFI) is Calculated
Alright, enough with the fluff—let’s get into the nitty-gritty. The MFI is all about combining price and volume, two factors that give you the complete story. While other indicators might just focus on price or volume alone, MFI combines them both, which makes it that much more powerful.
Here’s how it works:
- Typical Price:
Typical Price = (High + Low + Close) / 3
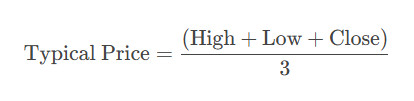
This is the average price for a specific period. Get used to it, because it’s key to calculating everything that comes next. - Raw Money Flow:
Raw Money Flow = Volume × Typical Price

This is where the magic happens. It multiplies the volume by the typical price, giving you the “money flow” into or out of the asset. - Money Flow Ratio:
Money Flow Ratio = Positive Money Flow / Negative Money Flow
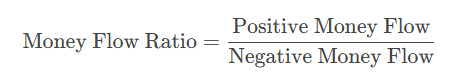
Simple math here, but crucial. Positive flow happens when prices go up, negative flow when they drop. The ratio gives you the balance of power between the bulls and bears. - Final MFI Calculation:
MFI = 100 – [100 / (1 + Money Flow Ratio)]
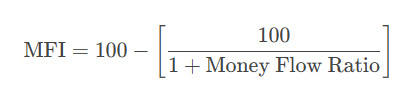
This final formula gives you the MFI reading between 0 and 100, telling you exactly where the market stands in terms of buying vs. selling pressure.
Takeaway:
This isn’t rocket science, but you better know your numbers. The MFI gives you a volume-weighted view of price movement that tells you when buyers or sellers are really in control.
🧐 Understanding the MFI Scale: Interpreting Overbought and Oversold Conditions
Now, let’s talk about the scale—because understanding it is critical to making money. The MFI value tells you exactly where things are at.
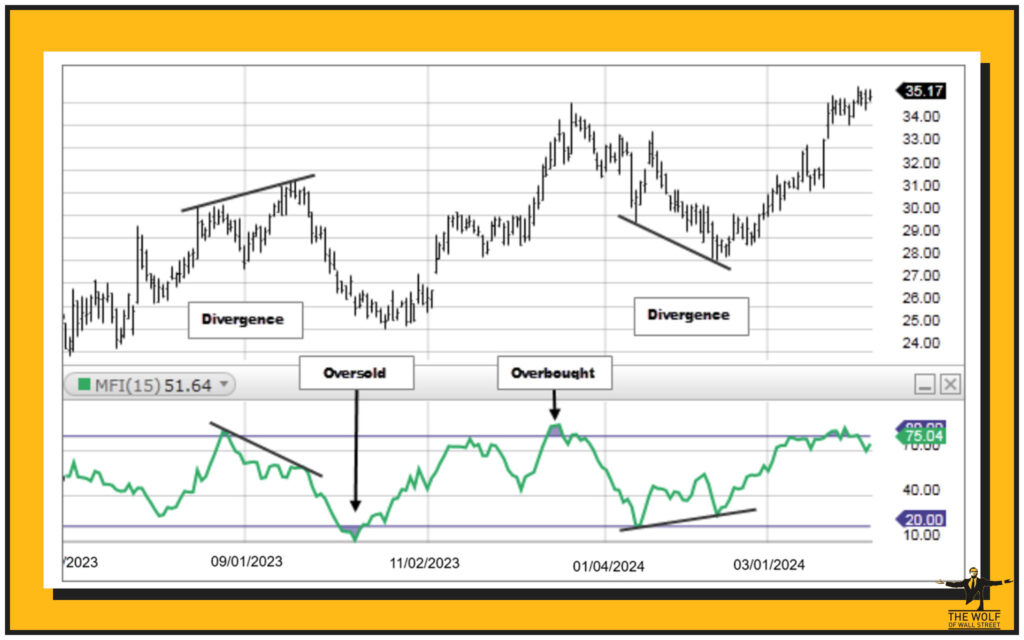
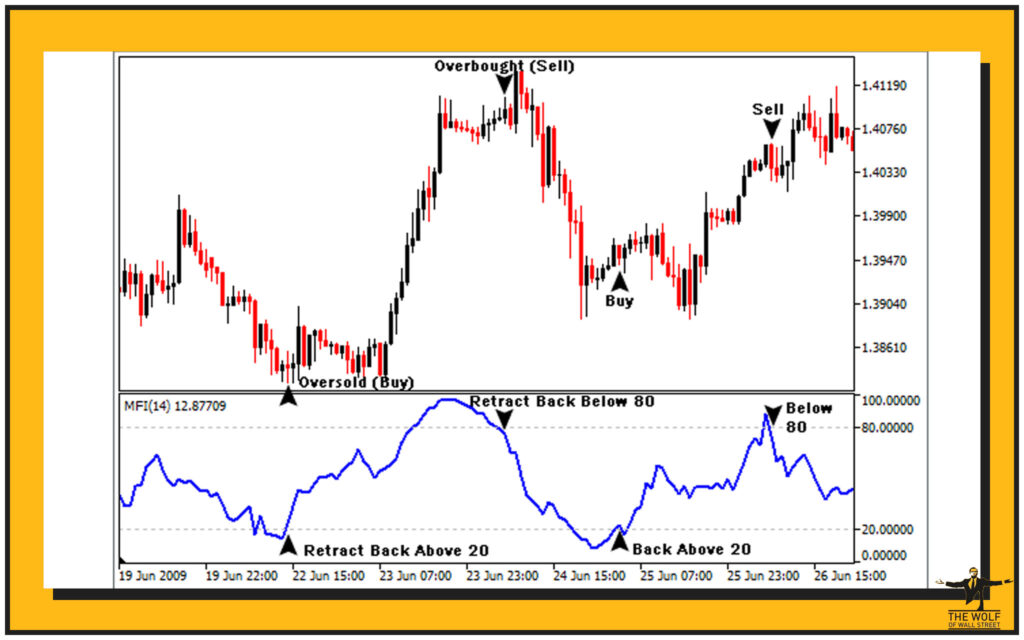
- MFI Above 80:
You’re in overbought territory. That means buyers are likely starting to overextend themselves. Think of it like a rubber band stretched too far—it’s about to snap back. MFI above 80? Time to think about selling or locking in profits. - MFI Below 20:
We’re talking oversold conditions. Prices have dropped too far too fast. This is where opportunity strikes. A low MFI below 20 is your chance to buy the dip, especially when combined with other technical indicators like candlestick patterns or support levels.
Understanding these levels is like having an insider tip on the market. But don’t act blindly—always confirm with other signals.
📉 The Role of MFI in Identifying Market Sentiment
In today’s market, sentiment is everything. The MFI tells you whether the bulls are in charge, or if the bears are about to take over. Volume plays a huge role here—if prices are rising but volume is dropping, that’s a red flag. But if prices and volume are moving in the same direction, it’s a sign of genuine market strength.
This is where The Wolf of Wall Street approach comes in—use MFI to not just follow the market but to anticipate moves before they happen. If the MFI spikes but price continues to fall, you’ve got a divergence on your hands—an early warning for a reversal.
📚 Integrating MFI with Other Trading Indicators
You think you can just rely on MFI alone? Think again. True pros know that success lies in the combination of tools. Here’s how you can integrate MFI with other indicators to boost your success rate:
- Moving Averages (MA):
Moving averages give you the long-term trend, while MFI shows you the short-term market sentiment. Combine them, and you’ve got a killer strategy. MFI below 20, combined with a bullish crossover on the 50-day MA, is your green light. - Relative Strength Index (RSI):
MFI + RSI = a power combo. MFI is volume-weighted, while RSI is price-based. When both indicators show overbought or oversold readings, the chances of a trend reversal go through the roof. - Candlestick Patterns:
Candlestick patterns can confirm what MFI is telling you. If the MFI is below 20 and you see a bullish engulfing pattern, you’re looking at a strong buy signal. You want to use these combinations to get in and out of the market quickly and efficiently.
🔄 Best Strategies for Trading with MFI in 2025
Alright, you’re here to make money, not waste time. So here’s how you use MFI in 2025 for maximum profit:
- For Buy Signals:
When the MFI drops below 20 and starts to rise, and you’ve got a bullish candlestick pattern or a bounce off support—BUY. The market is primed for a reversal. - For Sell Signals:
When MFI is above 80, you need to lock in profits. A downturn in price near resistance, combined with a bearish candlestick pattern, is your cue to exit. - Divergence:
Divergence between price and MFI? Pay attention. It’s the market’s way of telling you that something’s about to change, and you can profit from it if you’re quick on your feet.
🛠️ Tools and Resources for Enhancing MFI Trading Accuracy
If you’re going to play with the big boys, you need the best tools. MFI is great, but here’s how you can make it even more lethal:
- Volume Calculators:
These are your secret weapon. They help you verify MFI readings, especially in high-volume markets like crypto and forex, where volume spikes can throw off traditional analysis. - AI and Automation:
2025 is the year of AI. With AI, you can automate the process of scanning the markets for the exact MFI setups you’re looking for. This means faster, more precise trading. - Backtesting:
You don’t just blindly trust an indicator. You test it. Backtest your MFI strategy over different market conditions to ensure it’s rock-solid before putting real money on the line.
🚫 Limitations of the MFI: What to Watch Out For
Look, MFI isn’t perfect. It can give false signals, especially if you’re not careful. Overbought or oversold conditions might last longer than you expect, so you need to keep an eye on the broader market context.
- False Signals:
If MFI is in extreme territory and the price keeps going in the same direction, don’t panic. Just be aware of the larger trend. Sometimes, markets can remain overbought or oversold for longer than expected. - Accurate Volume Data:
Garbage data equals garbage results. Make sure your volume data is accurate—because if it’s not, MFI’s insights can be totally skewed.
💡 Practical Tips for Using MFI in Your Trading Plan
Let me give you the real deal on how to use MFI effectively:
- Use Multiple Indicators:
MFI alone won’t make you rich. Use it alongside moving averages, RSI, and candlestick patterns. Diversify your toolkit. - Stay Consistent:
You want to make consistent profits? Stick to your plan. Don’t jump in and out based on every little movement. Stay disciplined. - Monitor Market Context:
MFI works best when combined with the bigger market picture. Know the broader trend and be aware of any major events (like upcoming crypto regulations, or market news that could trigger volatility).
📆 The Future of MFI in Trading: Trends and Innovations
Here’s what’s coming next—AI and Machine Learning are going to revolutionize how we use MFI. By 2025, trading will be dominated by automated systems that can detect patterns faster and more accurately than any human ever could. MFI’s role will only grow, especially in crypto markets, where the volume can be a wild ride.
As the market evolves, so will MFI. Get ahead of the curve and start integrating new tools now. Automation, backtesting, and AI will all be part of your MFI strategy, making it stronger than ever.
📈 Conclusion: Mastering MFI for Enhanced Trading Precision in 2025
Listen up, if you want to succeed in 2025, MFI is a tool you simply can’t afford to ignore. It’s volume-weighted, it’s accurate, and when used with other indicators, it gives you a massive edge in the market. Whether you’re trading stocks, forex, or crypto, MFI can help you make smarter, faster, and more profitable trades.
So, now it’s on you. Master MFI, combine it with powerful tools, and watch your trading game go to the next level.
❓ FAQs About Money Flow Index (MFI)
- How does the Money Flow Index compare to other volume-based indicators like On-Balance Volume (OBV)?
MFI takes it a step further by integrating price and volume to give you a fuller picture. OBV only tracks volume and price direction, but MFI’s combination of both gives more reliable signals. - What are the best practices for combining MFI with candlestick patterns in trading strategies?
Look for confirmation. For instance, after an MFI dip below 20, a bullish candlestick pattern like an engulfing candle can signal a potential buying opportunity. - How can AI/ML tools improve the accuracy of technical indicators like MFI in modern trading environments?
AI and ML can analyze massive datasets, recognizing patterns faster than humans ever could. This allows for more accurate MFI signals, especially in fast-moving markets like crypto. - What are the key advantages of using MFI over other traditional indicators like RSI?
Unlike RSI, MFI considers both price and volume, providing a much clearer picture of market sentiment. It’s more comprehensive and reliable in spotting trends and reversals. - How do you avoid false signals when trading with MFI?
Confirm your MFI signals with other indicators, like moving averages or RSI. And always keep the broader market context in mind to avoid getting caught in false signals.