
You see prices jumping all over the chart, right? It looks random, noisy. But underneath all that, there’s a trend. And if you can spot the trend, you can trade it. That’s where Moving Averages come in. These lines cut through the noise, show you the true direction, and act as dynamic support and resistance. This isn’t complicated; it’s fundamental. Get this right, and you build the base for serious trading success.

📈 What Are Moving Averages? Smoothing Out the Noise
A Moving Average (MA) is a simple but powerful technical indicator. At its core, it’s just the average price of an asset over a specific number of time periods (like days, hours, or minutes), plotted as a single line on your chart. What makes it ‘moving’ is that this average is recalculated with each new period’s price data, and the oldest data point is dropped. This constantly updates the average, causing the line to move along with the price action, but smoother.
Why Smooth Price Data?
Raw price data can be erratic. Short-term spikes or drops, known as ‘noise’, can be misleading if you’re trying to understand the overall direction. Moving Averages filter out this noise, giving you a clearer line that highlights the underlying trend. It removes the distractions so you can focus on what matters.
Identifying the Trend’s Direction
The slope of a Moving Average line tells you the direction of the trend. If the MA is sloping upwards, the trend is generally up. If it’s sloping downwards, the trend is generally down. A flat MA suggests sideways movement or consolidation. The direction of the MA provides a clear visual confirmation of the market’s path.
MAs as Dynamic Support and Resistance
Moving Averages don’t just show direction; they often act as dynamic support or resistance levels.
- In an uptrend, price often pulls back to the Moving Average line before bouncing and continuing higher. The MA acts like a moving floor of support.
- In a downtrend, price often rallies up to the Moving Average line before being rejected and continuing lower. The MA acts like a moving ceiling of resistance.
These dynamic levels provide potential areas to look for trade entries or exits.
(Imagine a price chart with an upward sloping Moving Average line plotted on it. Price candles are generally above the line, occasionally dipping down to touch or get close to it before the price starts rising again. This visually demonstrates the MA acting as support.)
🤔 SMA vs. EMA: Different Ways to Average
Not all Moving Averages are created equal. The two most common types, Simple Moving Average (SMA) and Exponential Moving Average (EMA), are calculated differently, which affects how they behave.
Simple Moving Average (SMA): The Basic Calculation.
The SMA is the most basic type. It’s simply the arithmetic mean of a set of closing prices over a specified number of periods. Each price in the dataset is given equal weight.
SMA = (Sum of closing prices over ‘n’ periods) / ‘n’
For example, to calculate a 5-day SMA, you add up the closing prices of the last 5 days and divide by 5.
(Imagine you have the following closing prices for 5 days: Day 1: £10, Day 2: £11, Day 3: £12, Day 4: £11.50, Day 5: £13. The 5-day SMA for Day 5 would be (10 + 11 + 12 + 11.50 + 13) / 5 = £57.50 / 5 = £11.50.)
To calculate the SMA for the next day (Day 6), you would drop Day 1’s price and add Day 6’s price to the sum of Days 2-5, then divide by 5.
Exponential Moving Average (EMA): Giving More Weight to Recent Price.
The EMA is a bit more complex. It gives more weight to the most recent closing prices, making it more sensitive and reactive to new information than an SMA of the same period. This is done using a smoothing factor.
EMA = (Price * Smoothing Factor) + (Previous EMA * (1 – Smoothing Factor))
The EMA calculation is recursive; it requires the EMA value from the previous period.
EMA’s Smoothing Factor: Why it Reacts Faster.
The smoothing factor is calculated as:
Smoothing Factor = [2 / (n + 1)]
where ‘n’ is the number of periods in the EMA. This factor determines how much impact the current period’s price has on the new EMA value. Because recent prices are weighted more heavily, the EMA turns and changes direction faster than an SMA when the trend begins to shift. It hugs the price action more closely.
Step-by-Step EMA Calculation Example
Let’s walk through a 3-period EMA calculation.
- Starting with Price Data: Assume closing prices for 4 periods: Period 1: £10, Period 2: £11, Period 3: £12, Period 4: £11.50.
- Calculating the Initial SMA: For the very first EMA value (Period 3), we often use a simple average of the first ‘n’ periods. So, the initial 3-period EMA for Period 3 is the 3-period SMA: (10 + 11 + 12) / 3 = £11.
- The Smoothing Factor Calculation: For a 3-period EMA, n=3. Smoothing Factor = [2 / (3 + 1)] = [2 / 4] = 0.5.
- Applying the EMA Formula Iteratively:
- EMA for Period 4: Price = £11.50. Previous EMA (from Period 3) = £11.
- EMA_Period4 = (Price_Period4 * Smoothing Factor) + (EMA_Period3 * (1 – Smoothing Factor))
- EMA_Period4 = (£11.50 * 0.5) + (£11 * (1 – 0.5))
- EMA_Period4 = (£11.50 * 0.5) + (£11 * 0.5)
- EMA_Period4 = £5.75 + £5.50 = £11.25.
The EMA for Period 4 is £11.25. This shows how the current price (£11.50) influenced the average more than past prices, giving it a slightly higher value than a 3-period SMA would likely be at this point if calculated traditionally.
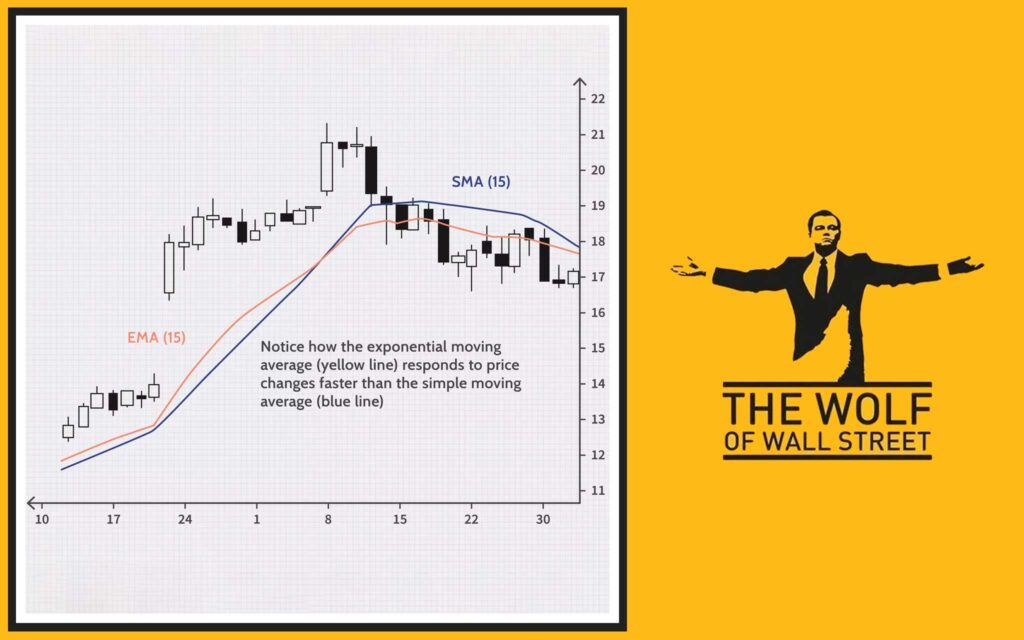
Visual Comparison: SMA vs. EMA Responsiveness
Because of the weighting, an EMA is always faster to react to price changes than an SMA of the same period.
(Picture a price chart with a 20-period SMA (maybe a smoother, lagging line) and a 20-period EMA (a wavier line that follows the price candles more closely) both plotted. When price makes a sharp turn, the EMA will visibly turn sooner than the SMA. This visually demonstrates the EMA’s greater responsiveness.)
🎯 Using Moving Averages: Signals and Strategies
Moving Averages are more than just visual aids; they generate concrete trading signals.
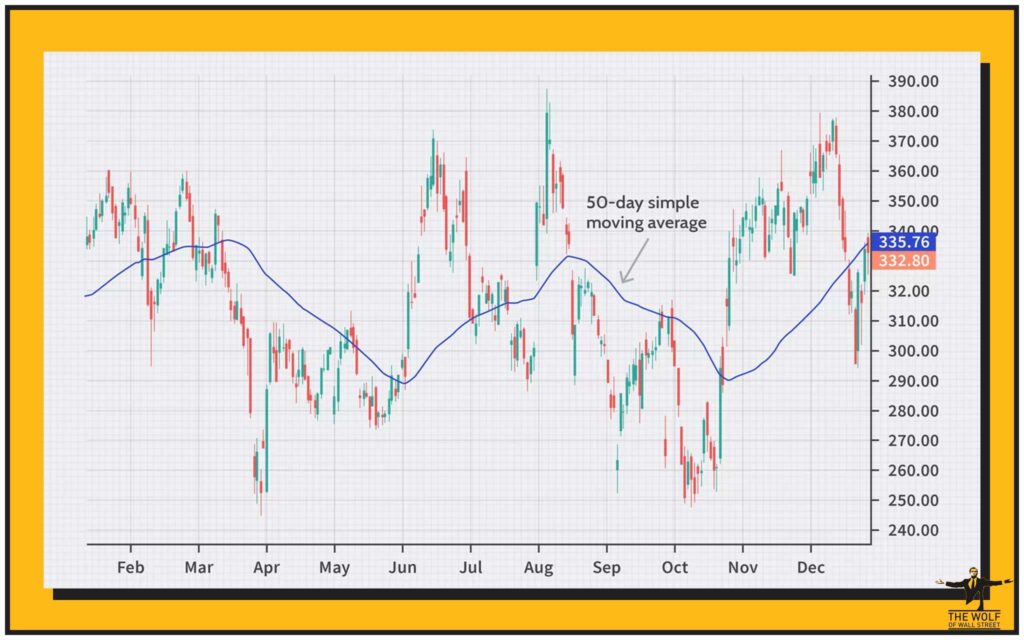
Single Moving Average: Trend Confirmation and Dynamic S/R.
The simplest strategy is using a single Moving Average (often a 50-period, 100-period, or 200-period MA) to confirm the trend.
- If price is trading consistently above the MA, the trend is bullish. You favour long trades.
- If price is trading consistently below the MA, the trend is bearish. You favour short trades.
You can also use the MA as a dynamic support (in uptrends) or resistance (in downtrends) for entries. Wait for price to pull back to the MA and look for a bounce. (Describe a chart example where price repeatedly pulls back to a 50-day MA in an uptrend and bounces off it, showing the MA acting as support.)
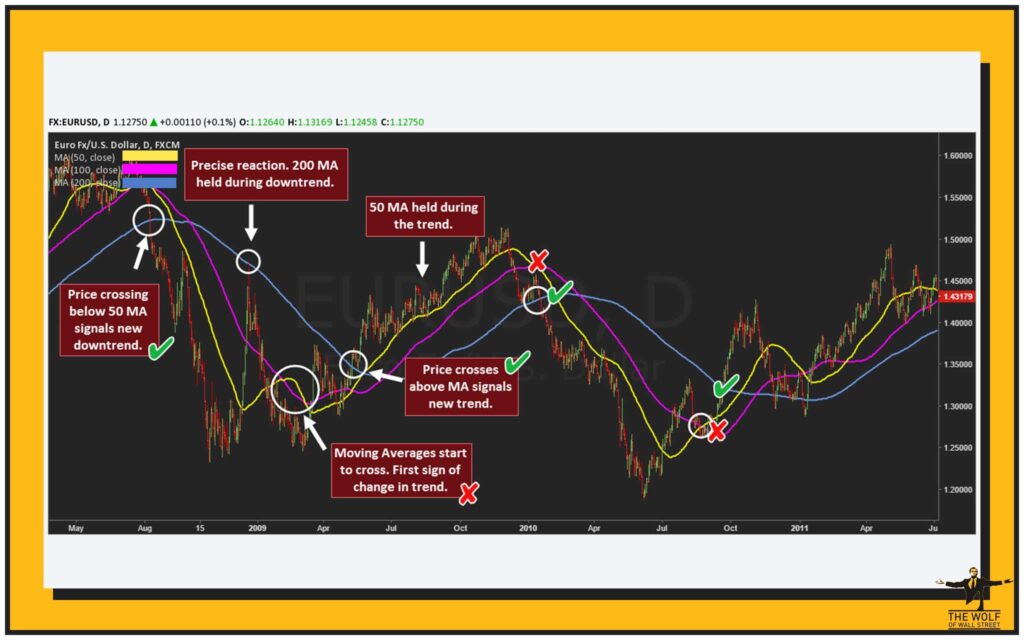
Moving Average Crossovers: Classic Trading Signals.
A very popular strategy involves using two Moving Averages: a shorter-term MA and a longer-term MA. Trading signals are generated when the two lines cross over.
- Bullish Crossovers: Occurs when the shorter-period MA crosses above the longer-period MA. This signals that recent prices are, on average, higher than older prices, suggesting increasing buying pressure and potential for an uptrend. It’s a common buy signal.
- Bearish Crossovers: Occurs when the shorter-period MA crosses below the longer-period MA. This signals that recent prices are, on average, lower than older prices, suggesting increasing selling pressure and potential for a downtrend. It’s a common sell signal.
(Describe a chart example showing a 20-period MA crossing above a 50-period MA, followed by a sustained price rally (bullish crossover). Then show a later point where the 20-period MA crosses below the 50-period MA, followed by a price decline (bearish crossover).)
The Golden Cross and Death Cross: Specific long-term crossovers.
These are well-known long-term crossover signals.
- The Golden Cross is a bullish signal that occurs when the 50-period MA crosses above the 200-period MA. It suggests a major long-term bullish trend is starting.
- The Death Cross is a bearish signal that occurs when the 50-period MA crosses below the 200-period MA. It suggests a major long-term bearish trend is starting.
These signals are significant for long-term trend identification.
Trading Bounces and Breaks of MAs: Acting on price interaction with the average.
Beyond crossovers, traders actively trade how price interacts with MAs.
- Bounces: Entering a trade when price pulls back and finds support at an MA in an uptrend, or finds resistance at an MA in a downtrend. This assumes the trend will continue.
- Breaks: A strong close of price above or below a significant MA can signal that the MA is failing as support/resistance and the trend might be changing. Trading the break can be a signal for a potential reversal or acceleration.
⏱️ The Concept of Lag: Why Past Data Matters (and Doesn’t)
The biggest limitation of Moving Averages is that they are lagging indicators. They are based on past price data, so they don’t predict future prices. They show you what the average price has been. This means MA signals tend to occur after the price move has already begun.
How MA Period Affects Lag
The number of periods you use in the calculation directly impacts the lag. A 10-period MA will hug the price much closer and react faster than a 100-period MA. The 100-period MA will be much smoother but will lag significantly more behind current price action.
Shorter Periods vs. Longer Periods: Choosing sensitivity vs. smoothness.
- Shorter Periods (e.g., 10, 20 periods) create MAs that are more sensitive to recent price changes. They generate more signals and react faster, but they also produce more false signals and whipsaws in choppy markets.
- Longer Periods (e.g., 50, 100, 200 periods) create MAs that are smoother and less sensitive to short-term noise. They generate fewer signals, but those signals tend to be more reliable for identifying significant, longer-term trends.
Choosing the Right Period: Matching MA to Trading Style and Asset Volatility.
The ‘best’ period for a Moving Average depends on your trading style and the asset you trade.
- Short-term traders might use shorter-period MAs (e.g., 10, 20) for faster signals.
- Swing traders might use medium-period MAs (e.g., 50) to capture medium-term trends.
- Long-term investors often use longer-period MAs (e.g., 100, 200) for major trend identification.
The volatility of the asset also matters. A very volatile asset like a cryptocurrency might require slightly longer periods to smooth out the larger price swings and reduce false signals compared to a less volatile stock. It takes experimentation to find what works best for your specific situation.
🏗️ Moving Averages as Foundational Tools
Moving Averages are fundamental. They are not just indicators on their own; they are also key components used in the calculation of many other powerful technical indicators.
MAs in Bollinger Bands
Bollinger Bands are a volatility indicator. They consist of a middle band (which is typically a 20-period Simple Moving Average) and two outer bands plotted at a standard deviation above and below that SMA. The SMA provides the central base around which the volatility is measured.
MAs in MACD
As we discussed earlier, the MACD indicator is directly calculated using Moving Averages. The core MACD Line is the difference between two Exponential Moving Averages (typically 12 and 26 periods), and the Signal Line is an EMA of the MACD Line itself. Without Moving Averages, MACD wouldn’t exist.
MAs in Other Indicators
Many other indicators also incorporate Moving Averages in their calculations, such as the Stochastic Oscillator (which compares a closing price to its price range over time, smoothed by MAs) or the Relative Strength Index (RSI) in some variations, although standard RSI doesn’t use MAs directly in its core formula, related indicators like the Smoothed RSI do. Many custom indicators also build upon MA concepts.
🤝 Combining Moving Averages with Other Analysis
Using Moving Averages in isolation can lead to whipsaws and false signals, especially in non-trending markets. Their true power comes from using them in combination with other technical analysis tools. Building confluence is essential.
MAs and Price Action/Candlestick Patterns
If price pulls back to a Moving Average and forms a bullish reversal candlestick pattern (like a hammer or bullish engulfing), that confluence of MA support and price action confirms the potential for a bounce.
MAs and Trendlines
Moving Averages often align with Trendlines. If a trendline provides support and a key Moving Average is at the same price level, that support zone is significantly strengthened. A break through both an MA and a trendline provides strong confirmation of a potential trend change (linking to Trendlines Article).
MAs and Fibonacci Levels
Similarly, Fibonacci Retracement and Extension levels can align with Moving Averages. If price pulls back to a 61.8% Fibonacci retracement level that also coincides with a 50-period Moving Average, that area becomes a high-probability support zone.
MAs and Momentum Indicators
Combining Moving Averages with momentum oscillators like RSI Trading Strategies or Stochastic Indicator Strategies is common. If price gets support at an MA and the momentum indicator simultaneously shows oversold conditions and is turning up, that’s a strong buy signal.
Understanding how different technical tools work together is part of building a solid foundation in trading, especially in dynamic digital asset markets discussed in resources on Cryptocurrencies. For anyone starting out, exploring resources that provide solid Trading Insights is a smart move. Beginners should focus on grasping the basics first, as explained in guides for Newbie traders. Advanced tools like Elliott Wave Theory provide broader pattern context that can complement MA signals.
🛑 Tips and Caveats: Using MAs Wisely
To get the most out of Moving Averages and avoid common pitfalls, keep these points in mind:
MAs are Lagging, Not Predictive
Always remember that MAs are based on past data. They confirm trends, they don’t predict them with certainty. Don’t expect an MA to tell you exactly where price will go next, only where the average has been.
Avoiding Whipsaws in Sideways Markets
Moving Averages perform poorly in choppy or sideways markets. During consolidation, MAs will flatten out and generate false crossover signals (whipsaws). It’s best to use other indicators or analysis methods to determine if the market is trending before relying heavily on MA signals.
Not Relying on a Single MA
Using multiple Moving Averages (like a system with a fast and a slow MA) or combining MAs with other types of indicators gives you a more complete picture and reduces reliance on a single line.
Always Seek Confirmation
Never trade based on a single MA signal alone. Always look for confirmation from price action, other indicators, or chart patterns. Confluence is your best friend.
🔢 Step-by-Step EMA Calculation Example
Let’s solidify the EMA calculation with a detailed example for a 5-period EMA.
- Starting with Price Data: Assume closing prices for 6 periods:
- Period 1: £20.00
- Period 2: £20.50
- Period 3: £21.00
- Period 4: £20.80
- Period 5: £21.50
- Period 6: £22.00
- Calculating the Initial SMA: For the very first EMA value (Period 5), we use the SMA of the first 5 periods.
- Initial 5-period SMA = (20.00 + 20.50 + 21.00 + 20.80 + 21.50) / 5 = £103.80 / 5 = £20.76.
- So, EMA_Period5 = £20.76.
- The Smoothing Factor Calculation: For a 5-period EMA, n=5.
- Smoothing Factor = [2 / (n + 1)] = [2 / (5 + 1)] = [2 / 6] = 0.3333 (approximately).
- Applying the EMA Formula Iteratively: Now we calculate the EMA for subsequent periods using the formula: EMA = (Price * Smoothing Factor) + (Previous EMA * (1 – Smoothing Factor)).
- EMA for Period 6:
- Price_Period6 = £22.00
- Previous EMA (from Period 5) = £20.76
- Smoothing Factor = 0.3333
- (1 – Smoothing Factor) = 1 – 0.3333 = 0.6667
- EMA_Period6 = (£22.00 * 0.3333) + (£20.76 * 0.6667)
- EMA_Period6 = £7.3326 + £13.840692
- EMA_Period6 = £21.173292 (approximately £21.17)
- EMA for Period 6:
This shows how the latest price (£22.00) had a significant impact on the calculation, making the EMA responsive. You would continue this iterative calculation for each new period’s closing price.

Frequently Asked Questions (FAQs)
- What is the main difference between SMA and EMA?
SMA gives equal weight to all prices in the period, while EMA gives more weight to recent prices, making it more responsive to current price changes. - How do Moving Averages help identify the trend?
The slope of the Moving Average line indicates the trend direction (upward slope = uptrend, downward slope = downtrend). Price trading consistently above or below the MA also confirms the trend. - What is a Moving Average crossover signal?
A crossover occurs when a shorter-period Moving Average crosses above (bullish) or below (bearish) a longer-period Moving Average, signalling a potential shift in the trend or momentum. - Why are Moving Averages considered lagging indicators?
They are based on past price data, meaning their signals occur after the price move has already begun. - Can a single Moving Average be used for trading decisions?
While a single MA can show trend direction and dynamic S/R, it is best used in conjunction with other indicators or analysis methods for confirmation to reduce false signals, especially in choppy markets.
There you have it – Moving Averages, your essential compass for market trends and a foundational piece of any serious trading toolkit.

“The Wolf Of Wall Street crypto trading community offers a comprehensive platform for navigating the volatile cryptocurrency market. Here’s what you gain:
- Exclusive VIP Signals: Access proprietary signals designed to maximize trading profits.
- Expert Market Analysis: Benefit from in-depth analysis from seasoned crypto traders.
- Private Community: Join a network of over 100,000 like-minded individuals for shared insights and support.
- Essential Trading Tools: Utilize volume calculators and other resources to make informed decisions.
- 24/7 Support: Receive continuous assistance from our dedicated support team.
Empower your crypto trading journey:
- Visit our website: https://tthewolfofwallstreet.com/ for detailed information.
- Join our active Telegram community: https://t.me/tthewolfofwallstreet for real-time updates and discussions.
- Unlock your potential to profit in the crypto market with “The Wolf Of Wall Street””