⚡ Introduction – The Wolf’s Take on Brandt’s Big Call
Peter Brandt, the chart wizard of commodities and crypto, has set the market buzzing again. He claims Bitcoin’s price chart is echoing the legendary 1970s soybean bubble – a setup that once led to a devastating 50% collapse. Sounds dramatic? It is. But when a trader with Brandt’s pedigree speaks, you pay attention. Ignore this pattern, and you might just miss the biggest market move of the decade.
💼 Who Is Peter Brandt – And Why You Should Care
Brandt isn’t some Twitter analyst hunting engagement. He’s a veteran trader with more than 40 years of experience who nailed several of Bitcoin’s past tops. When he calls out a “broadening top,” you don’t brush it off. You study it. His legacy is built on precision – spotting when markets are about to turn, and capitalising before the crowd wakes up.
📊 The “Broadening Top” Explained – The Chart That Screams Trouble
Let’s cut the fluff. A broadening top, also called a megaphone pattern, is a formation where prices swing higher highs and lower lows – volatility widening like a siren. In technical analysis, it’s often a warning that the market’s running out of steam. Traders fear it because it screams distribution – smart money cashing out while retail buyers pile in. And right now, Bitcoin’s chart is starting to look eerily similar.
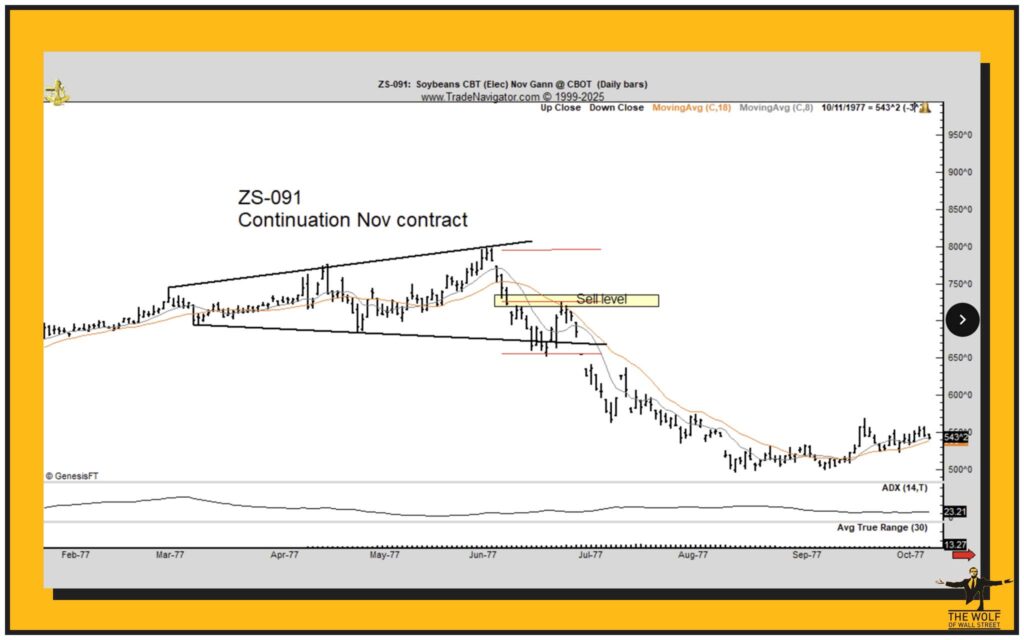
🌾 The Soybean Market Déjà Vu – Lessons from the 1970s Bubble

In the 1970s, soybeans went parabolic. Prices surged as global demand boomed, but when supply caught up, the bubble popped. Brandt recalls how soybeans formed a near-perfect broadening top before plunging around 50%. While some historians debate the exact figure, the collapse was brutal. The takeaway? Human greed hasn’t changed – only the assets have. Back then, it was soybeans. Today, it’s Bitcoin.
For deeper chart structure insight, check out the Elliott Wave Theory Trading Guide and Trendlines & Market Direction.
📉 Macro Backdrop – Why This Time Isn’t So Different
The parallels go beyond charts. Inflation’s creeping, liquidity cycles are tightening, and markets are swinging between euphoria and despair. Just like the 1970s commodity mania, Bitcoin thrives on scarcity narratives – until reality bites. The broader macro picture could amplify Brandt’s warning.
🚀 The Counter-Attack – Bulls Who See $250K on the Horizon
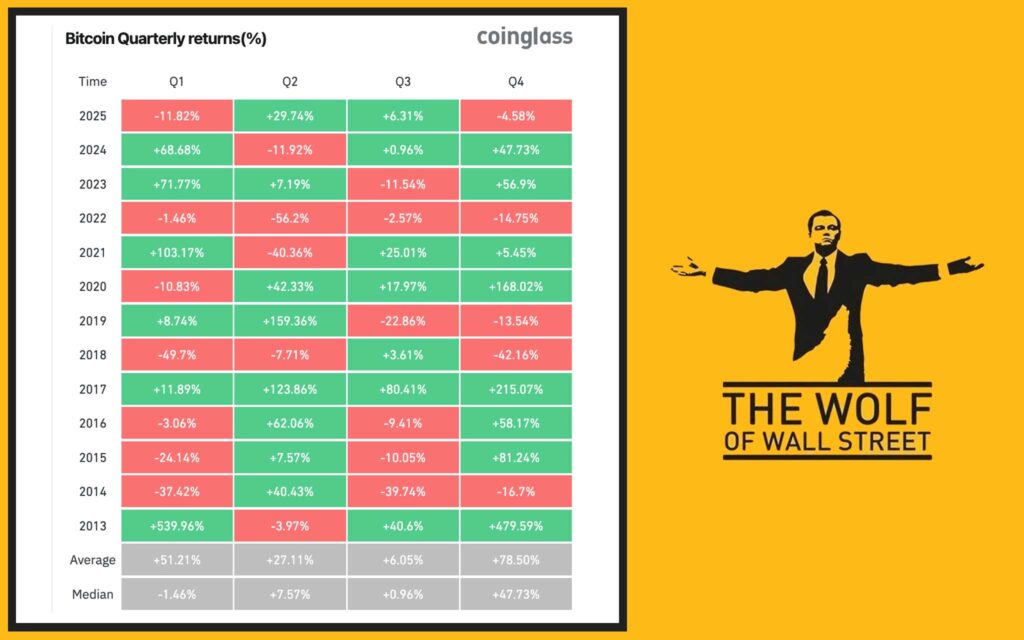
While Brandt waves red flags, bulls like Arthur Hayes see opportunity. Hayes predicts Bitcoin could still surge to $250,000 before any real correction. Seasonality supports him – historically, Q4 is Bitcoin’s strongest quarter with average returns of 78%. In short: the smart money’s divided, and volatility is guaranteed.
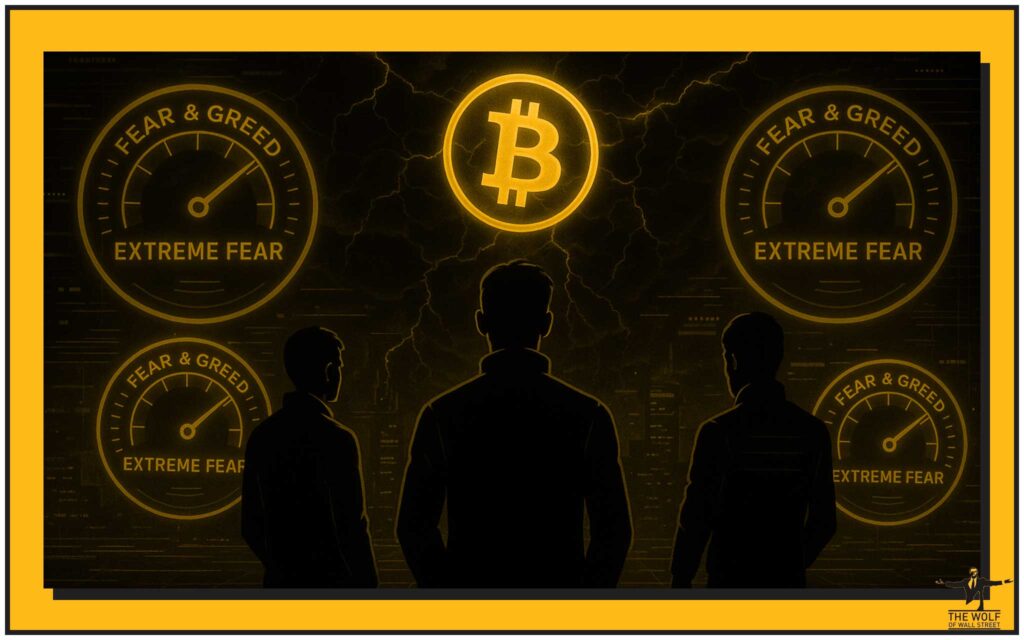
😨 Sentiment Snapshot – “Extreme Fear” and What It Really Means
The crypto Fear & Greed Index is screaming Extreme Fear (score 25). To the untrained eye, that’s bad news. But seasoned traders know fear often precedes massive reversals. When everyone’s panicking, that’s when real profits are made. The Wolf calls it: buy blood, sell champagne.
🏦 Institutional Exposure – MicroStrategy, ETFs, and the Domino Risk
MicroStrategy (MSTR), Bitcoin ETFs, and hedge funds have turned crypto into a corporate asset class. But that leverage cuts both ways. If prices dive, margin calls hit hard. It’s the modern echo of the 1970s – overexposed players holding too much of the same thing. For context, explore Bitcoin Spot & Derivatives Trading and Crypto Hedge Funds Market Shift.
🧠 Technical Deep Dive – What Confirms or Invalidates Brandt’s Pattern
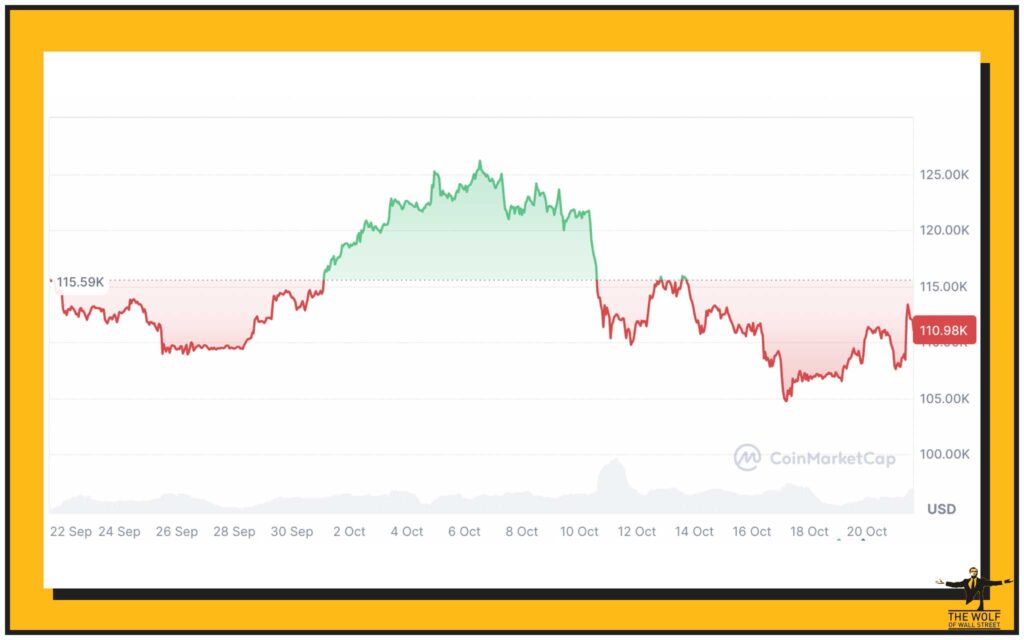
Here’s where traders earn their keep. Brandt’s thesis hinges on confirmation: volume spikes at new highs, followed by breakdowns below key support levels. If Bitcoin closes below $90K with expanding volume, the bears might finally be right. Invalidation? A breakout above $120K, sustained by volume and ETF inflows.
📚 Data Check – The 50% Soybean Drop Myth vs Reality
Brandt’s soybean story is directionally correct, but precise data from the U.S. Department of Agriculture shows multiple declines – not a single 50% drop. Still, the analogy works: unsustainable euphoria, overleveraged traders, and a brutal correction. Whether Bitcoin repeats history or writes its own depends on psychology, not soybeans (source).
📈 Seasonality Edge – Why Q4 Could Flip the Script
Since 2013, Q4 has delivered Bitcoin’s strongest returns. “Uptober” isn’t just a meme – it’s statistical. On average, Bitcoin gains over 70% in Q4 as traders reposition for year-end. CoinGlass data confirms it. Brandt’s bearish setup might meet its match if liquidity surges before year-end.
🦴 What Traders Can Learn – Pattern Recognition & Risk Discipline
Every chart tells a story. The lesson here isn’t fear – it’s discipline. Recognise when emotion clouds logic. Manage position size. Use stop losses. Combine pattern recognition with momentum indicators like RSI Crypto Trading Strategies and Money Flow Index Strategies 2025. The wolf doesn’t panic; he plans.
🐺 The The Wolf Of Wall Street Advantage – Profit with the Pack
Here’s where traders separate themselves from the herd. The The Wolf Of Wall Street crypto trading community delivers the tools and intelligence you need to dominate volatility:
- Exclusive VIP Signals: Real-time alerts built to maximise profits.
- Expert Market Analysis: Veteran traders break down complex trends.
- Private Community: 150,000+ traders exchanging insights 24/7.
- Trading Tools: Calculators, risk trackers, and volume metrics.
- 24/7 Support: Your questions answered – always.
Join the The Wolf Of Wall Street Telegram group and turn information into execution.
🔥 Wolf-Style Action Plan – How to Trade Smart Amid Chaos

When markets shake, weak hands tremble. Wolves sharpen their fangs. Here’s the Belfort-style action plan:
- Observe: Don’t react to emotion – read the data.
- Prepare: Build positions with stop losses; no hero trades.
- Strike: Follow signals, exploit volatility, and bank profits before the herd knows what happened.
The key? Controlled aggression – just enough risk to stay dangerous, never enough to get destroyed.
💪 What If Brandt Is Wrong? – The Bull Case Revisited
History rhymes, but it doesn’t repeat perfectly. Bitcoin’s structure is global, digital, and adaptive – not a grain silo from 1975. If adoption accelerates, liquidity expands, and ETFs attract trillions, Brandt’s megaphone could turn into a launchpad. Don’t fight data; adapt to it.
🏁 Closing the Loop – Fear, Greed, and the Power of Preparation
At the end of the day, markets don’t punish ignorance – they punish inaction. Brandt’s warning is a lesson in humility and preparation. Whether Bitcoin crashes 50% or rockets 100%, those who study, plan, and execute win. The rest just watch.

Join the pack. Learn the rules. Trade with intent. Visit The Wolf Of Wall Street and take control of your trading journey today.
❓ FAQs
Q1: What exactly is a broadening top pattern?
A: It’s a volatile formation where price swings widen with higher highs and lower lows. It often indicates uncertainty and distribution – smart money exiting while retail investors enter.
Q2: Why does Peter Brandt’s opinion carry weight?
A: Brandt’s 40+ years in trading commodities and crypto make him one of the most respected chartists alive. When he speaks, institutions listen.
Q3: Could Bitcoin really drop 50% again?
A: Anything’s possible in crypto. The 50% figure is an analogy, not a prophecy. It highlights risk – not inevitability.
Q4: How can traders protect themselves from volatility?
A: Use position sizing, stop losses, and verified signal systems like The Wolf Of Wall Street to manage risk and react with data – not emotion.
Q5: Where can I learn more about trading strategies?
A: Dive into Master Crypto Dominance Trading Strategies or Crypto Profit-Taking Wolf’s Guide for advanced insights.