Look, if you want to make money in markets, you need to know what’s actually happening. Forget the noise. The first thing you learn, the absolute bedrock, is the trend. And the simplest way to see that trend? Trendlines. This isn’t just about drawing lines; it’s about spotting market direction, finding support, hitting resistance, and seeing opportunities before they vanish. This guide shows you how to use them to your advantage.

📈 What Are Trendlines? The Basics of Market Direction
A trendline is exactly what it sounds like: a line drawn on a price chart that connects a series of significant highs or lows. Its purpose is simple yet profound: it visually represents the prevailing direction of price action. If price is generally moving up, you draw an uptrend line. If it’s generally moving down, you draw a downtrend line.
Connecting the Dots: How two points define a line.
The beauty of a trendline lies in its simplicity. To draw a valid trendline, you need at least two significant price points. For an uptrend line, you connect two consecutive swing lows. For a downtrend line, you connect two consecutive swing highs. Once you have two points, you extend the line into the future. A third touch confirms the validity and strength of the line.
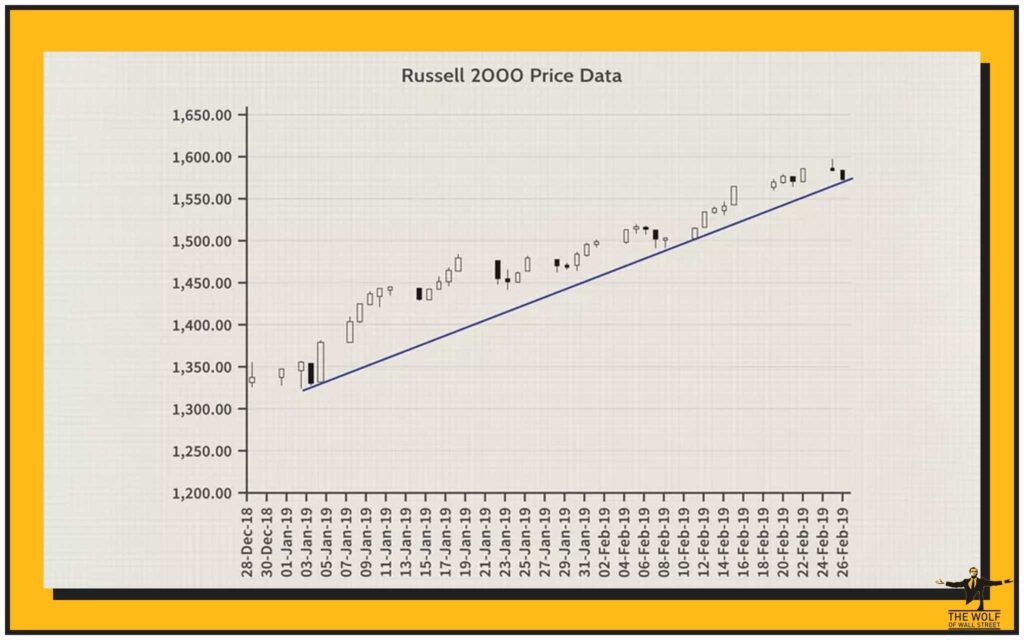
Trendlines as Support and Resistance: Visualising price barriers.
One of the most powerful uses of trendlines is their ability to act as dynamic support or resistance.
- An uptrend line acts as dynamic support: As price moves up, it often pulls back to touch the trendline before continuing higher. This line becomes a ‘floor’ where buyers might step in.
- A downtrend line acts as dynamic resistance: As price moves down, it often bounces up to touch the trendline before continuing lower. This line becomes a ‘ceiling’ where sellers might step in.
These lines give you objective levels to watch for potential entries or exits.
Universal Application: Working across all timeframes – from minutes to months.
The power of trendlines is their versatility. They work on any timeframe. Whether you’re a day trader looking at 5-minute charts, a swing trader on hourly charts, or a long-term investor on weekly charts, the principles of trendlines remain the same. A valid trendline on a daily chart will likely hold more weight than one on a 15-minute chart, but the concept applies universally. This means you can use this tool regardless of your trading style.
📐 Drawing Powerful Trendlines: Rules for Success
Drawing trendlines might seem easy, but doing it right is what separates the pros from the amateurs. It’s about precision and letting the market dictate the line, not forcing it.
Connecting Significant Pivot Points: Focusing on the major highs and lows.
Don’t just connect any two random points. You need to connect significant swing highs (where an uptrend ended and price started to fall) or swing lows (where a downtrend ended and price started to rise). These are the pivot points that represent major shifts in market sentiment. A strong trendline connects the absolute low of a trend to the subsequent lowest point during a pullback for an uptrend, or the absolute high to the subsequent highest point during a bounce for a downtrend.
The “Rule of Three”: Why three touches make a trendline more reliable.
While you can draw a trendline with just two points, it becomes truly significant and reliable after the third touch. Each additional touch confirms the line’s strength. If price respects the line multiple times, it tells you that many market participants are watching and reacting to that level. This increases the probability that the line will hold on subsequent tests.
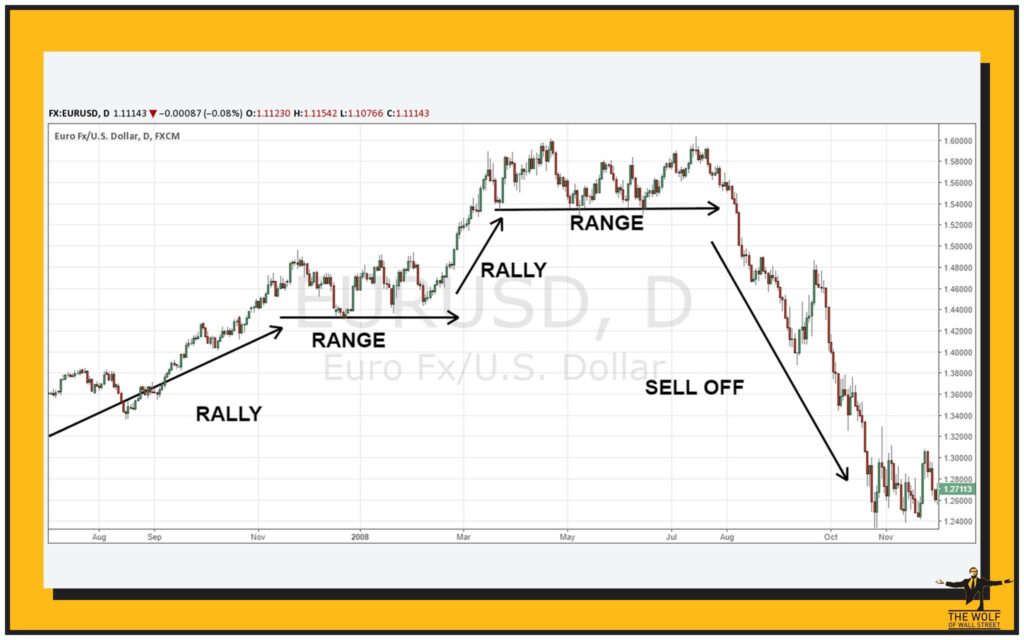
Using Wicks vs. Body Closes: Which part of the candle to connect for accuracy.
This is a common debate among traders. Some prefer to connect the absolute high or low of the candle (the ‘wick’), while others prefer connecting the closing or opening prices (the ‘body’). For most technical analysis, connecting the wick extremes is generally preferred because it captures the full extent of price movement. However, consistency is key. Pick a method and stick with it. The precise touch points are less important than the overall integrity and consistent slope of the line.
Avoiding Forced Trendlines: Letting the market show you the line, not forcing one.
This is a critical rule. A valid trendline will present itself. You shouldn’t try to make a trendline fit price action by forcing it through multiple candles or ignoring clear violations. If a trendline looks like a struggle to draw, it’s likely not a true trendline. Let the market show you the clear points to connect. Don’t create a line where there isn’t a natural trend.
✅ Uptrend Lines: The Path of Rising Prices
An uptrend is characterised by a series of higher swing lows and higher swing highs. An uptrend line is drawn by connecting at least two significant swing lows. Once drawn, you extend it into the future. This line acts as a dynamic support level.
When price pulls back and touches the uptrend line, it’s often a sign that buyers are stepping in again to support the asset at that level, driving price higher. These touches are potential entry points for long positions. A break below a well-established uptrend line can signal a change in the trend or a shift to a corrective phase.
📉 Downtrend Lines: The Path of Falling Prices
Conversely, a downtrend is characterised by a series of lower swing highs and lower swing lows. A downtrend line is drawn by connecting at least two significant swing highs. This line acts as dynamic resistance.
When price rallies and touches the downtrend line, it’s often a sign that sellers are stepping in to push the price lower, confirming the downward momentum. These touches are potential entry points for short positions. A break above a well-established downtrend line can signal a change in the trend or a shift to a corrective phase.
🛣️ Understanding Trend Channels: Price Corridors
Sometimes, price not only respects a single trendline but also moves within a parallel channel. A trend channel is formed by drawing a second line parallel to your primary trendline.
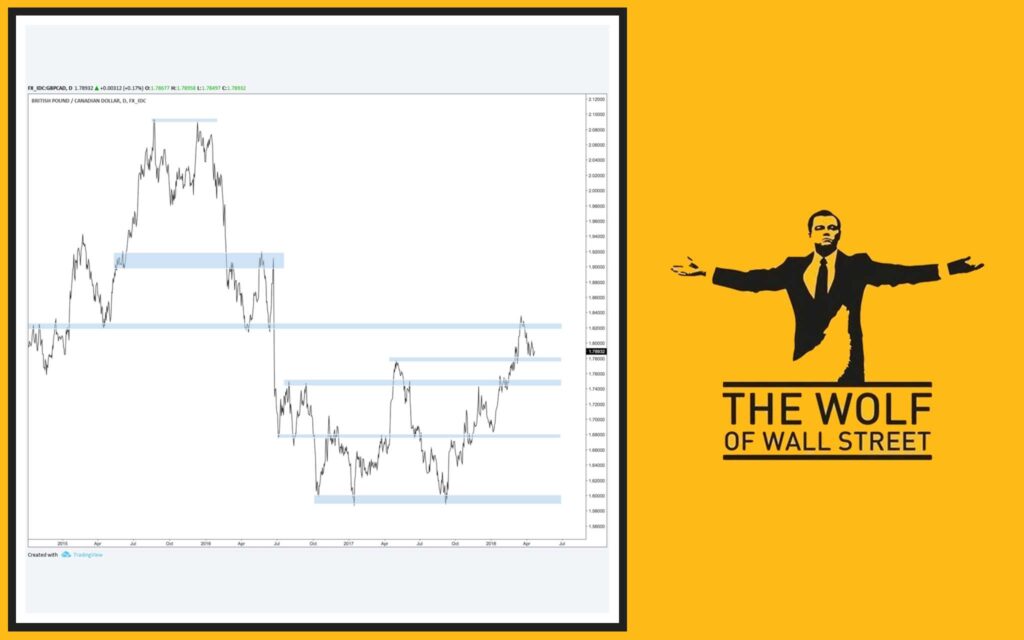
Drawing Parallel Channels: Creating upper and lower boundaries.
- For an uptrend channel, you draw the primary uptrend line connecting the swing lows. Then, you draw a parallel line from a significant swing high (usually the first major high after the trend began). This parallel line becomes the channel’s upper boundary, acting as dynamic resistance.
- For a downtrend channel, you draw the primary downtrend line connecting the swing highs. Then, you draw a parallel line from a significant swing low (usually the first major low after the trend began). This parallel line becomes the channel’s lower boundary, acting as dynamic support.
Trading Within Channels: How price oscillates between channel lines.
Price often oscillates within these channels, bouncing between the support and resistance lines. Trading within a channel means buying near the lower trendline (support) and selling near the upper trendline (resistance) in an uptrending channel, or vice versa in a downtrending channel. A break out of a channel can signal a stronger move in the breakout direction or a potential trend reversal.
🎯 Actionable Trading Signals with Trendlines
This is where the rubber meets the road. Trendlines aren’t just for looking at pretty charts; they give you concrete signals for entries and exits.
Entries on Trendline Bounces: Buying support, selling resistance.
This is the most common strategy. In an uptrend, wait for price to pull back and touch the uptrend line. If you see a reversal candlestick pattern or other confirmation that buyers are stepping in, you enter a long position. Your stop loss would be placed just below the trendline. In a downtrend, you’d do the opposite: wait for price to bounce up and touch the downtrend line, look for bearish confirmation, and enter a short position with a stop loss just above the line.
Trading Trendline Breaks: Signals of a potential trend change.
A significant break of a well-established trendline can signal that the trend is weakening or changing direction.
- A break below an uptrend line suggests a bullish trend is ending or reversing to a downtrend.
- A break above a downtrend line suggests a bearish trend is ending or reversing to an uptrend.
These breaks are powerful signals, but they need confirmation.
Retests of Broken Trendlines: Confirming the new trend direction or a fakeout.
After a trendline is broken, price often returns to ‘retest’ the broken line before continuing in the new direction. A broken support line can act as new resistance, and a broken resistance line can act as new support.
- If price breaks below an uptrend line, then rallies back up to touch the broken line (now acting as resistance) and rejects it, this is a strong confirmation signal for a new downtrend. You might enter a short position here.
- If price breaks above a downtrend line, then pulls back to touch the broken line (now acting as support) and bounces, this confirms a new uptrend. You might enter a long position here.
Using Trendlines for Exit Signals: Knowing when to get out.
Trendlines aren’t just for entries. If you’re in a long position in an uptrend, a clear break below your uptrend line could be your signal to exit, protecting your profits or limiting losses. The same applies to short positions in a downtrend; a break above the downtrend line signals it’s time to close.
📊 Strength and Validity of Trendlines
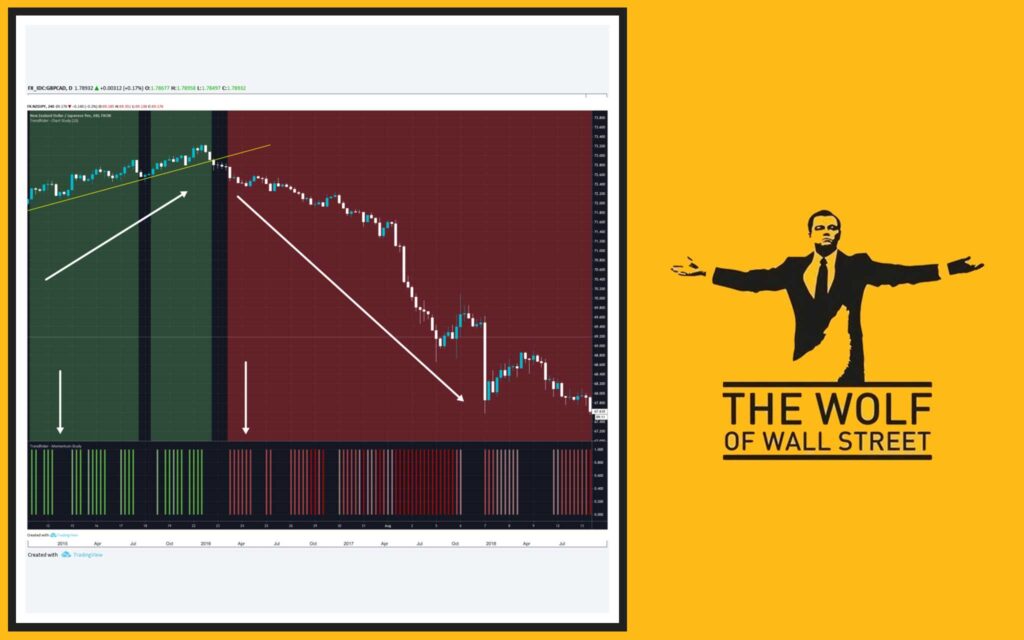
Not all trendlines are created equal. Some are stronger and more reliable than others.
Number of Touches and Duration: The more, the stronger.
A trendline that has been touched and respected by price multiple times (at least three) is more reliable than one with only two touches. Similarly, a trendline that has held for a longer period (e.g., months vs. days) is more significant than a short-term one. These factors increase the probability that the line will continue to hold in the future.
The Angle of the Trendline: Steepness indicating trend strength.
The slope of your trendline matters.
- A shallow trendline (low angle) indicates a slow, steady trend. These trends are often more sustainable.
- A steep trendline (high angle) indicates a very strong, fast-moving trend. While exciting, very steep trendlines are often unsustainable and price tends to break them more easily or correct sharply. They show exuberance that can’t last.
A balance is key – a trend that is too flat might be weak, but one that is too steep might be close to exhaustion.
Confirming Breaks with Volume: High volume adds credibility to a break.
When price breaks a trendline, always check the volume. A break accompanied by significantly higher trading volume is a much stronger signal that the trend is truly changing direction. A break on low volume could be a false breakout or a temporary fluctuation. Volume gives conviction to the break.
🛑 Spotting False Breakouts: Avoiding Traps
This is where many traders get caught. Price might break a trendline, tempting you to enter a trade, but then it snaps back, trapping you in a losing position. These are false breakouts, or ‘whipsaws’.
Recognising Whipsaws and Fakeouts: Price briefly breaking, then reversing.
A false breakout often looks like a quick pierce of the trendline, followed by the price closing back within the original trendline or channel. These are designed to shake out traders who jump in too early.
Confirmation Filters for Breaks: Waiting for candle closes or additional signals.
To avoid false breakouts, don’t just act on a temporary pierce of the line.
- Wait for a Confirmed Close: For instance, wait for a daily candle to close definitively below an uptrend line, or above a downtrend line, before considering it a valid break.
- Wait for a Retest: As discussed, a retest of the broken trendline that then fails to re-enter the old trend is a much stronger confirmation signal.
- Volume Confirmation: Only consider breaks valid if they come with increased volume.
These filters force patience, which is a valuable trait in trading.
🤝 Trendlines with Other Tools: Building Confluence
Trendlines are fantastic, but they are just one piece of the puzzle. Their power multiplies when combined with other technical analysis tools. This builds confluence, where multiple signals point to the same conclusion, increasing the probability of your trade working out.
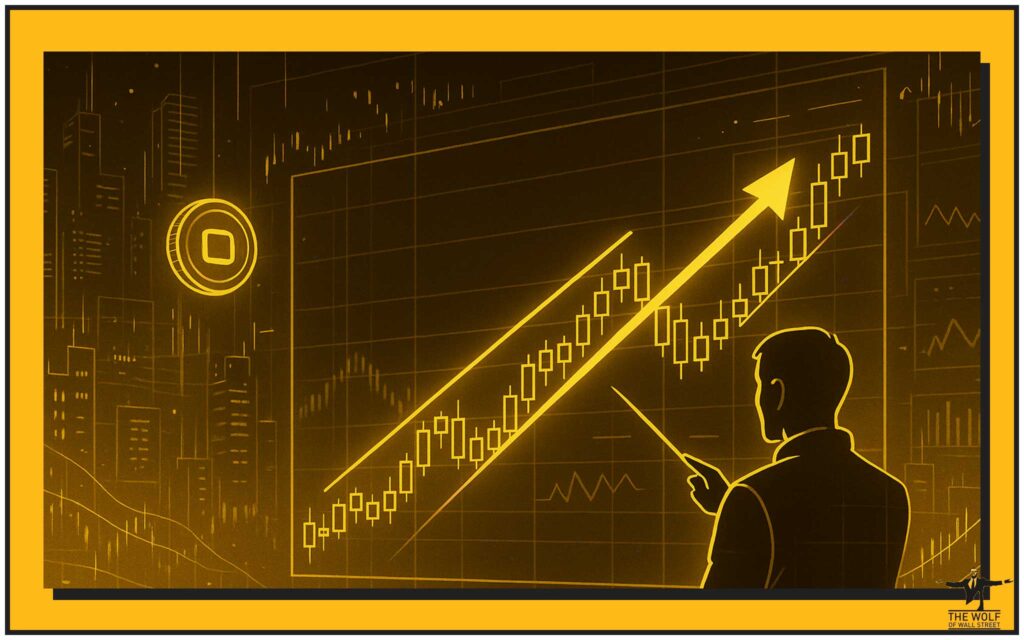
Trendlines and Moving Averages: When they align as dynamic support/resistance.
Moving averages (MAs) are often used as dynamic support or resistance. If a key moving average (like a 50-period or 200-period MA) aligns with a trendline that price is testing, it provides a much stronger level of support or resistance. This increases the probability of a bounce or a rejection.
Trendlines and Momentum Indicators: Using RSI or Stochastic to confirm bounces/breaks.
Momentum indicators like RSI Trading Strategies or Stochastic Indicator Strategies show whether a price move is overbought or oversold and the speed of price change. If price hits an uptrend line (potential support) and RSI is in oversold territory and turning up, that’s a strong buy signal. Conversely, a break below an uptrend line with a momentum indicator showing bearish divergence adds conviction to the break.
Trendlines and Volatility Tools: How Bollinger Bands can confirm trendline reactions.
Bollinger Bands measure market volatility. If price is bouncing off a trendline and simultaneously touching an outer Bollinger Band, it suggests a strong reaction at that level and a potential reversion to the mean or continuation of the trend.
Trendlines and Pattern Analysis: Combining with Fibonacci or Elliott Wave for bigger picture analysis.
Advanced pattern analysis tools often work hand-in-hand with trendlines. For instance, Fibonacci Retracement and Extension levels often align with key trendlines, forming strong support or resistance zones. Similarly, in Elliott Wave Theory, impulse and corrective waves often occur within well-defined channels or are bounded by trendlines. Understanding these relationships gives you a more comprehensive view of market structure.
Understanding these basic technical tools is key for navigating any market, especially the dynamic digital asset markets discussed in resources on Cryptocurrencies. For anyone starting out, getting a handle on these concepts is a solid first step, as explained in guides for Newbie traders. Mastering chart analysis takes practice and access to reliable Trading Insights.
Frequently Asked Questions (FAQs)
- What is the minimum number of points needed to draw a valid trendline?
You need at least two significant swing highs or lows to draw a basic trendline, but a third touch confirms its validity and strength. - How do you differentiate a true trendline break from a false one?
A true break is often confirmed by a close of a candle (e.g., daily close) beyond the trendline, increased volume, or a successful retest of the broken line. False breaks often reverse quickly back into the trend. - Can trendlines be used on all timeframes?
Yes, trendlines are versatile and can be drawn and used on any timeframe, from minute charts to weekly or monthly charts. - What does the angle or steepness of a trendline indicate?
The angle of a trendline indicates the strength or sustainability of a trend. Very steep lines often signal unsustainable moves that are prone to sharp corrections or reversals. - Should trendlines be used in isolation for trading decisions?
No, trendlines are most effective when used in conjunction with other technical analysis tools and indicators to confirm signals and build confluence.
There you have it – Trendlines, your essential tool for seeing the true direction of the market and making moves that generate profit.
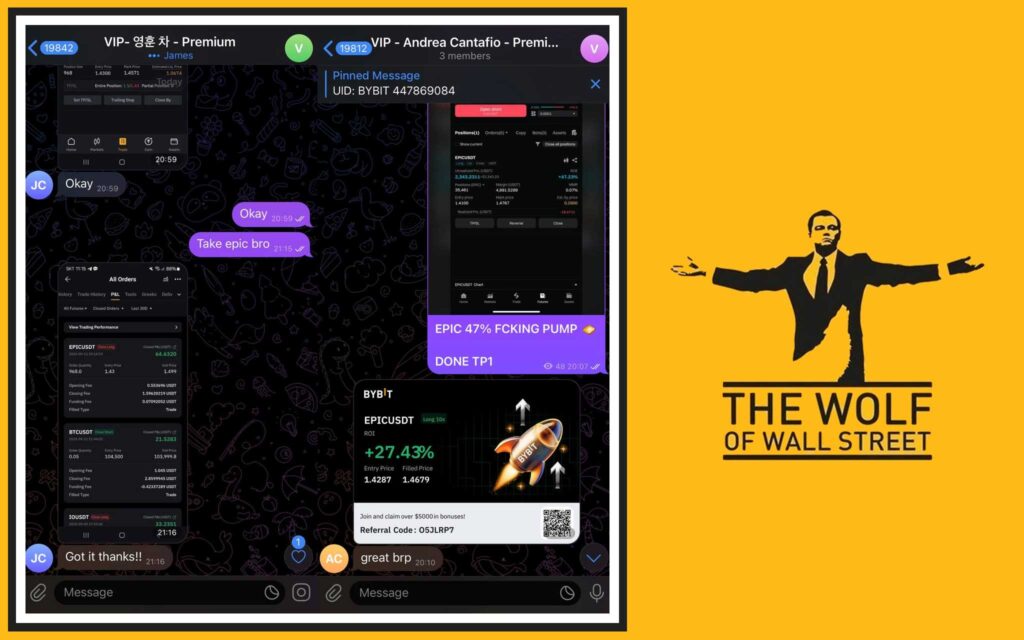
“The Wolf Of Wall Street crypto trading community offers a comprehensive platform for navigating the volatile cryptocurrency market. Here’s what you gain:
- Exclusive VIP Signals: Access proprietary signals designed to maximize trading profits.
- Expert Market Analysis: Benefit from in-depth analysis from seasoned crypto traders.
- Private Community: Join a network of over 100,000 like-minded individuals for shared insights and support.
- Essential Trading Tools: Utilize volume calculators and other resources to make informed decisions.
- 24/7 Support: Receive continuous assistance from our dedicated support team.
Empower your crypto trading journey:
- Visit our website: https://tthewolfofwallstreet.com/ for detailed information.
- Join our active Telegram community: https://t.me/tthewolfofwallstreet for real-time updates and discussions.
- Unlock your potential to profit in the crypto market with “The Wolf Of Wall Street””


